$ cd fundamentals-of-devops
$ mkdir -p ch3/ansible
$ cp ch2/ansible/create_ec2_instances_playbook.yml ch3/ansible/
$ cp ch2/ansible/inventory.aws_ec2.yml ch3/ansible/
$ cd ch3/ansiblePart 3. How to Manage Your Apps Using Orchestration Tools

Update, June 25, 2024: This blog post series is now also available as a book called Fundamentals of DevOps and Software Delivery: A hands-on guide to deploying and managing software in production, published by O’Reilly Media!
This is Part 3 of the Fundamentals of DevOps and Software Delivery series. In Part 2, you learned how to manage your infrastructure as code, including how to deploy a server to run an app. In this blog post, you’re going to shift your focus from managing infrastructure to managing apps. Running a single copy of your app is fine for learning, and for some use cases, a single copy may be all you ever need, but if your business depends on that app, having just a single copy may cause a number of problems, such as outages due to hardware issues (e.g., the server dies), outages due to software issues (e.g., a bug that causes your app to crash), and outages due to load (e.g., your app becomes so popular, it exceeds the capacity of a single server).
In short, a single copy of your app is a single point of failure. To run applications in production, you typically need multiple copies, called replicas, of your app. Moreover, you also need a way to handle the many other requirements of running an app, such as automatically restarting it if it crashes, deploying more replicas when there is heavy load, balancing load across multiple replicas, communicating with other apps, and so on. Although you could build your own solutions for managing apps, it’s a tremendous amount of work, and there are tools out there that do it for you: these are called orchestration tools.
If you search around, you’ll quickly find that there are many orchestration tools out there, including Kubernetes (including EKS, GKE, and AKS), OpenShift, EC2, ECS, Marathon / Mesos, Nomad, AWS Lambda, Google Cloud Functions, Azure Serverless, and many others. Which one should you use? How do these tools compare?
Most orchestration tools can be grouped into one of the following four categories:
-
Server orchestration: e.g., use Ansible to deploy code onto a cluster of servers.
-
VM orchestration: e.g., deploy VMs into an EC2 Auto Scaling Group.
-
Container orchestration: e.g., deploy containers into a Kubernetes cluster.
-
Serverless orchestration: e.g., deploy functions using AWS Lambda.
To help you navigate the orchestration space, this blog post will walk you through each of these categories. Along the way, you’ll work through examples where you deploy the same app using each of these approaches, which will let you see how different orchestration approaches perform across a variety of dimensions (e.g., rolling out updates, load balancing, auto scaling, auto healing, and so on), so that you can pick the right tool for the job. Let’s get started by understanding exactly what orchestration is, and why it’s important.
An Introduction to Orchestration
In the world of classical music, a conductor is responsible for orchestration: that is, they direct the orchestra, coordinating all the individual members to start or stop playing, to increase or decrease the tempo, to play quieter or louder, and so on. In the world of software, an orchestration tool is responsible for orchestration: it directs software clusters, coordinating all the individual apps to start or stop, to increase or decrease the hardware resources available to them, to increase or decrease the number of replicas, and so on.
These days, for many people, the term "orchestration" is associated with Kubernetes, but the underlying needs have been around since the first programmer ran the first app for others to use. Anyone running an app in production needs to solve most or all of the following core orchestration problems:
- Deployment
-
You need a way to deploy one or more replicas of your app onto your servers and to periodically roll out updates to your replicas, ideally without your users experiencing downtime (known as a zero-downtime deployment).
- Scheduling
-
For each deployment, you need to decide which apps should run on which servers, ensuring that each app gets the resources (CPU, memory, disk space) it needs. This is known as scheduling. With some orchestration tools, you do the scheduling yourself, manually; other orchestration tools provide a scheduler that can do it automatically, and this scheduler usually implements some sort of bin packing algorithm to try to use the resources available as efficiently as possible.
- Rollback
-
If there is a problem when rolling out an update, you need a way to roll back all replicas to a previous version.
- Auto scaling
-
As load goes up and down, you need a way to automatically scale your app up and down in response. This may include vertical scaling, where you scale the resources available to your existing servers up or down, such as getting faster CPUs, more memory, or bigger hard drives, as well as horizontal scaling, where you deploy more servers and/or more replicas of your app across your servers.
- Auto healing
-
You need something to monitor your apps, detect if they are not healthy (i.e., the app is not responding correctly or at all), and to automatically restart or replace unhealthy apps or servers.
- Load balancing
-
If you are running multiple replicas of your app, you may need a way to distribute traffic across all those replicas.
- Configuration
-
If you have multiple environments, you need a way to configure the app differently in each environment: e.g., use different domain names or different memory settings in dev, stage, and prod.
- Secrets management
-
You may need a way to securely pass sensitive configuration data to your apps (e.g., passwords, API keys).
- Service communication
-
If you are running multiple apps, you may need to give them a way to communicate with each other, including a way to find out how to connect to other apps (service discovery), and ways to control and monitor that communication, including authentication, authorization, encryption, error handling, observability, and so on (service mesh).
- Disk management
-
If your app stores data on a hard drive, then as you deploy replicas of your app, you need to ensure the right hard drives end up with the right replicas.
Over the years, there have been dozens of different approaches to solving each of these problems. In the pre-cloud era, since every on-prem deployment was different, most companies wrote their own bespoke solutions, typically consisting of gluing together various scripts and tools to solve each problem. Nowadays, the industry is starting to standardize around four broad types of solutions: server orchestration, VM orchestration, container orchestration, and serverless orchestration. The following sections will dive into each of these, starting with server orchestration.
Server Orchestration
The original approach used in the pre-cloud era, and one that, for better or worse, is still fairly common today, is to do the following:
-
Set up a bunch of servers.
-
Deploy your apps across the servers.
-
When you need to roll out changes, update the servers in place.
I’ve seen companies use a variety of tools for implementing this approach, including configuration management tools (e.g., Chef, Puppet, and Ansible, as you saw in Part 2), specialized deployment scripts (e.g., Capistrano, Deployer, Mina; full list), and, perhaps most common of all, ad hoc scripts.
Because this approach pre-dates the cloud era, it also predates most attempts at creating standardized tooling for it, and I’m not aware of any single, commonly accepted name for it. Most people would just refer to it as "deployment tooling," as deployment was the primary focus (as opposed to auto scaling, auto healing, service discovery, etc.). For the purposes of this blog post series, I’ll refer to it as server orchestration, to disambiguate it from the newer orchestration approaches you’ll see later, such as VM and container orchestration.
|
Key takeaway #1
Server orchestration is an older, mutable infrastructure approach where you have a fixed set of servers that you maintain and update in place. |
To get a feel for server orchestration, let’s use Ansible. In Part 2, you saw how to deploy a single EC2 instance using Ansible. In this post, you’ll first use Ansible to deploy multiple servers, and once you have several servers to work with, you’ll be able to see what server orchestration with Ansible looks like in practice.
Example: Deploy an App Securely and Reliably Using Ansible
|
Example Code
As a reminder, you can find all the code examples in the blog post series’s sample code repo in GitHub. |
The first thing you need for server orchestration is a bunch of servers. You can spin up several EC2 instances by reusing the Ansible playbook and inventory file you created in Part 2.[11] Head into the fundamentals-of-devops folder you’ve been using to work through the examples in this blog post series, create a new ch3/ansible subfolder, and copy into that subfolder create_ec2_instances_playbook.yml and inventory.aws_ec2.yml from Part 2:
This time, you’ll override the default variables in the playbook to create multiple EC2 instances with different names and ports. To do this, create a file called sample-app-vars.yml, with the contents shown in Example 24:
Example 24. Sample app variables file (ch3/ansible/sample-app-vars.yml)
num_instances: 3
base_name: sample_app_instances
http_port: 8080This variables file will create three servers named sample_app_instances that allow incoming HTTP requests on
port 8080. To run the playbook, authenticate to AWS, and run the ansible-playbook command, adding the --extra-vars
flag to pass in the variables file:
$ ansible-playbook \
-v create_ec2_instances_playbook.yml \
--extra-vars "@sample-app-vars.yml"Next, you’ll need to create a group variables file to configure the SSH user, private key, and host key checking
settings. Since sample-app-vars.yml set base_name to sample_app_instances, create a file called
group_vars/sample_app_instances.yml, with the contents shown in Example 25:
Example 25. Sample app group variables (ch3/ansible/group_vars/sample_app_instances.yml)
ansible_user: ec2-user
ansible_ssh_private_key_file: sample_app_instances.key
ansible_host_key_checking: falseNow you can configure the servers in this group to run the Node.js sample app, but with improved security and reliability. As explained in Watch out for snakes: these examples have several problems, the code used to deploy apps in the previous blog posts had security and reliability issues: e.g., running the app as a root user, listening on port 80, no automatic app restart in case of crashes, and so on. It’s time to fix these issues and get this code closer to something you could use in production.
Create a new playbook called configure_sample_app_playbook.yml, with the contents shown in Example 26:
Example 26. Sample app playbook (ch3/ansible/configure_sample_app_playbook.yml)
- name: Configure servers to run the sample-app
hosts: sample_app_instances (1)
gather_facts: true
become: true
roles:
- role: nodejs-app (2)
- role: sample-app (3)
become_user: app-user (4)Here’s what this playbook does:
| 1 | Target the sample_app_instances group. |
| 2 | Instead of a single sample-app role that does everything, as you saw in Part 2, the
code in this blog post uses two roles. The first role, called nodejs-app, is responsible for
configuring a server to run Node.js apps. You’ll see the code for this role shortly. |
| 3 | The second role is called sample-app, and it’s responsible for running the sample app. You’ll see the code
for this role shortly as well. |
| 4 | The sample-app role will be executed as the OS user app-user, which is a user that the nodejs-app role creates,
rather than as the root user. |
For the nodejs-app role, create just one file, roles/nodejs-app/tasks/main.yml:
roles

  └── nodejs-app

      └── tasks

          └── main.yml
Put the code shown in Example 27 into tasks/main.yml:
Example 27.
nodejs-app role tasks (ch3/ansible/roles/nodejs-app/tasks/main.yml)- name: Add Node Yum repo (1)
yum_repository:
name: nodesource-nodejs
description: Node.js Packages for x86_64 Linux RPM based distros
baseurl: https://rpm.nodesource.com/pub_23.x/nodistro/nodejs/x86_64
gpgkey: https://rpm.nodesource.com/gpgkey/ns-operations-public.key
- name: Install Node.js
yum:
name: nodejs
- name: Create app user (2)
user:
name: app-user
- name: Install pm2 (3)
npm:
name: pm2
version: latest
global: true
- name: Configure pm2 to run at startup as the app user
shell: eval "$(sudo -u app-user pm2 startup -u app-user | tail -n1)"The nodejs-app is fairly generic, usable with almost any Node.js app:
| 1 | Install Node.js, just as you’ve seen before. |
| 2 | Create a new OS user called app-user. This allows you to run your apps with a user with more limited permissions
than root. |
| 3 | Install PM2 and configure it to run on boot. You’ll see what PM2 is shortly. |
For the sample-app role, create two subfolders, files and tasks:
roles

  ├── nodejs-app

  └── sample-app

      ├── files

      │   ├── app.config.js

      │   └── app.js

      └── tasks

          └── main.yml
app.js is the exact same "Hello, World" Node.js sample app you saw in Part 1. Copy it into the files folder:
$ cp ../../ch1/sample-app/app.js roles/sample-app/files/app.config.js is a new file that is used to configure PM2. So, what is PM2? PM2 is a process supervisor, which is a tool you can use to run your apps, monitor them, restart them after a reboot or a crash, manage their logging, and so on. Process supervisors provide one layer of auto healing for long-running apps. You’ll see other types of auto healing later in this post.
There are many process supervisors out there, including PM2, supervisord, and systemd (full list), with systemd as the one you’re likely to use, as it’s built into most Linux distributions these days. For this example, I picked PM2 because it has features designed specifically for Node.js apps. To use these features, create a configuration file called app.config.js, as shown in Example 28:
Example 28. PM2 configuration file (ch3/ansible/roles/sample-app/files/app.config.js)
module.exports = {
apps : [{
name : "sample-app",
script : "./app.js", (1)
exec_mode: "cluster", (2)
instances: "max",
env: {
"NODE_ENV": "production" (3)
}
}]
}This file configures PM2 to do the following:
| 1 | Run app.js to start the app. |
| 2 | Run in cluster mode, so that instead of a single Node.js process, you get one process per CPU, ensuring your app uses all the CPUs on your server. |
| 3 | Set the NODE_ENV environment variable to "production," which tells Node.js apps and plugins to run in
production mode. |
Finally, create tasks/main.yml with the contents shown in Example 29:
Example 29.
sample-app role tasks (ch3/ansible/roles/sample-app/tasks/main.yml)- name: Copy sample app (1)
copy:
src: ./
dest: /home/app-user/sample-app
- name: Start sample app using pm2 (2)
shell: pm2 start app.config.js
args:
chdir: /home/app-user/sample-app
- name: Save pm2 app list so it survives reboot (3)
shell: pm2 saveThe preceding code does the following:
| 1 | Copy the code in the files folder (app.js, app.config.js) to the server. |
| 2 | Use PM2 to start the app in the background and start monitoring it. |
| 3 | Save the list of apps PM2 is running so that if the server reboots, PM2 will automatically restart those apps. |
These changes address the concerns in Watch out for snakes: these examples have several problems: the code is more secure, as you’re no longer running as root, more reliable, as you’re using a process supervisor, and more performant, as you’re using all CPUs and running in production mode.
To try this code out, authenticate to AWS, and run the following command:
$ ansible-playbook -v -i inventory.aws_ec2.yml configure_sample_app_playbook.ymlAnsible will discover your servers, and on each one, install Node.js, and run your sample app. At the end, you should see the IP addresses of servers, as shown in the following log output (truncated for readability):
PLAY RECAP ************************************

13.58.56.201               : ok=9    changed=8

3.135.188.118              : ok=9    changed=8

3.21.44.253                : ok=9    changed=8
Copy the IP of one of the three servers, open http://<IP>:8080 in your web browser, and you should see the
familiar "Hello, World!" text once again.
While three servers is great for redundancy, it’s not so great for usability, as your users typically want just a single endpoint to hit. This requires deploying a load balancer, as described in the next section.
Example: Deploy a Load Balancer Using Ansible and Nginx
A load balancer is a piece of software that can distribute load across multiple servers or apps. You give your users a single endpoint to hit, which is the load balancer, and under the hood, the load balancer forwards the requests it receives to a number of different endpoints, using various algorithms (e.g., round-robin, hash-based, least-response-time, etc.) to process requests as efficiently as possible. There are many load balancer options, including those you run yourself, such as Apache, Nginx, and HAProxy, as well as managed load balancers, such as AWS Elastic Load Balancer and GCP Cloud Load Balancer (full list).
In the cloud, you’d most likely use a cloud load balancer, as you’ll see later in this blog post. However, for the purposes of server orchestration, I decided to show you a simplified example of how to run your own load balancer, as server orchestration techniques should work on-prem as well. Therefore, you’ll be deploying Nginx.
To do that, you need one more server. You can deploy one more EC2 instance using the same create_ec2_instances_playbook.yml, but with a new variables file, nginx-vars.yml, with the contents shown in Example 30:
Example 30. Variables file for Nginx (ch3/ansible/nginx-vars.yml)
num_instances: 1
base_name: nginx_instances
http_port: 80This will create a single EC2 instance, with the name nginx_instances, and it will allow requests on port 80,
which is the default port for HTTP. Authenticate to AWS and run the playbook with this vars file as follows:
$ ansible-playbook \
-v create_ec2_instances_playbook.yml \
--extra-vars "@nginx-vars.yml"This should create one more EC2 instance you can use for nginx. Since the base_name for that instance is
nginx_instances, that will also be the group name in the inventory, so configure the variables for this group by
creating group_vars/nginx_instances.yml with the contents shown in Example 31:
Example 31. Group variables for Nginx (ch3/ansible/group_vars/nginx_instances.yml)
ansible_user: ec2-user
ansible_ssh_private_key_file: nginx_instances.key
ansible_host_key_checking: falseNow you can configure these servers to run Nginx by using an Ansible role called nginx that I’ve open sourced in the
GitHub repo https://github.com/brikis98/devops-book-nginx-role. Using this role will give you a taste of what it’s like
to use third-party roles, such as those on GitHub or Ansible Galaxy. The nginx role
installs Nginx, has it listen on port 80, and configures it to load balance all traffic to the / URL across the list
of servers you pass in via the servers input variable. To use the nginx role, create a file called
requirements.yml with the contents shown in Example 32:
Example 32. Specify the
nginx role as a dependency (ch3/ansible/requirements.yml)- name: nginx
src: https://github.com/brikis98/devops-book-nginx-role
version: 1.0.0Next, run the ansible-galaxy command to install the role:
$ ansible-galaxy role install -r requirements.ymlNow you can create a new playbook that uses this role in a file called configure_nginx_playbook.yml, with the contents shown in Example 33:
Example 33. Configure Nginx (ch3/ansible/configure_nginx_playbook.yml)
- name: Configure servers to run nginx
hosts: nginx_instances (1)
gather_facts: true
become: true
roles:
- role: nginx (2)
vars: (3)
servers: >-
{{ groups['sample_app_instances']
| map('extract', hostvars, 'private_dns_name')
| map('regex_replace', '$', ':8080')
| list }}This playbook does the following:
| 1 | Target the nginx_instances group you configured in your inventory. |
| 2 | Configure the servers in that group using the nginx role you just installed. |
| 3 | Use Jinja template syntax to set the servers input variable to the private IP address and port 8080 of each
of your sample app servers. |
Authenticate to AWS and run this playbook as follows:
$ ansible-playbook -v -i inventory.aws_ec2.yml configure_nginx_playbook.ymlWait a few minutes for everything to deploy and in the end, you should see log output that looks like this:
PLAY RECAP

xxx.us-east-2.compute.amazonaws.com : ok=4    changed=2    failed=0
The value on the left, "xxx.us-east-2.compute.amazonaws.com," is a domain name you can use to access the Nginx server.
If you open http://xxx.us-east-2.compute.amazonaws.com (this time with no port number, as Nginx is listening on port
80, the default port for HTTP) in your browser, you should see "Hello, World!" yet again. Each time you refresh the
page, Nginx will send that request to a different EC2 instance (known as round-robin load balancing). Congrats, you
now have a single endpoint you can give your users, and that endpoint will automatically balance the load across
multiple servers!
Example: Roll Out Updates with Ansible
So you’ve now seen how to deploy using a server orchestration tool, but what about doing an update? Some configuration management tools support various deployment strategies (a topic you’ll learn more about in Part 5), such as a rolling deployment, where you update your servers in batches, so some servers are always running and serving traffic, while others are being updated. Example 34 shows how to update configure_sample_app_playbook.yml to do a rolling deployment:
Example 34. Rolling deployment (ch3/ansible/configure_sample_app_playbook.yml)
- name: Configure servers to run the sample-app
# ... (other params omitted for clarity) ...
serial: 1 (1)
max_fail_percentage: 30 (2)| 1 | Setting serial to 1 tells Ansible to apply changes to one server at a time. Since you have three servers total,
this ensures that two servers are always available to serve traffic, while one goes down briefly for an update. |
| 2 | The max_fail_percentage parameter tells Ansible to abort a deployment if more than this percent of servers hit an
error during upgrade. Setting this to 30% with three servers means that Ansible will abort the deployment if even a
single server hits an error, so you never lose more than one server to a broken update. |
Let’s give the rolling deployment a shot. Update the text that the app responds with in app.js, as shown in Example 35:
Example 35. Update the app response text (ch3/ansible/roles/sample-app/files/app.js)
res.end('Fundamentals of DevOps!\n');And re-run the playbook:
$ ansible-playbook -v -i inventory.aws_ec2.yml configure_sample_app_playbook.ymlAnsible will roll out the change to one server at a time. When it’s done, if you refresh the Nginx IP in your browser, you should see the text "Fundamentals of DevOps!"
|
Get your hands dirty
Here are a few exercises you can try at home to go deeper:
|
When you’re done experimenting with Ansible, you should manually undeploy the three EC2 instances as shown in Figure 9. This ensures that your account doesn’t start accumulating any unwanted charges.
Now that you’ve seen server orchestration, let’s move on to VM orchestration.
VM Orchestration
The idea with VM orchestration is to do the following:
-
Create VM images that have your apps and all their dependencies fully installed and configured.
-
Deploy the VM images across a cluster of servers.
-
Scale the number of servers up or down depending on your needs.
-
When you need to deploy an update, create new VM images, deploy those onto new servers, and then undeploy the old servers.
This is a slightly more modern approach that works best with cloud providers such as AWS, GCP, and Azure, where the servers are all virtual servers, so you can spin up new ones and tear down old ones in minutes. That said, you can also use virtualization on-prem with tools such as VMWare, Citrix, or Microsoft Hyper-V. The example in this blog post will be of VM orchestration on AWS, but the concepts apply to most VM orchestration tools, whether in the cloud or on-prem.
|
Key takeaway #2
VM orchestration is an immutable infrastructure approach where you deploy and manage VM images across virtualized servers. |
Let’s go through an example of VM orchestration. The first step is to build a VM image, as per the next section.
Example: Build a VM Image Using Packer
Head into the fundamentals-of-devops folder you created in Part 1 to work through the examples in this blog post series, and create a new subfolder for the Packer code:
$ cd fundamentals-of-devops
$ mkdir -p ch3/packerCopy the Packer template and install-node.sh script you created in Part 2 into the new ch3/packer folder:
$ cp ch2/packer/sample-app.pkr.hcl ch3/packer/
$ cp ch2/packer/install-node.sh ch3/packer/You should also copy app.js (the sample app) and app.config.js (the PM2 configuration file) from the Ansible example into the ch3/packer/sample-app folder:
$ mkdir -p ch3/packer/sample-app
$ cp ch3/ansible/roles/sample-app/files/app*.js ch3/packer/sample-appIf you had updated app.js to respond with "Fundamentals of DevOps!" to test out rolling deployments with Ansible, change the response text back to "Hello, World!" in ch3/packer/sample-app/app.js, as shown in Example 36:
Example 36. Respond with "Hello, World!" (ch3/packer/sample-app/app.js)
const server = http.createServer((req, res) => {
res.writeHead(200, { 'Content-Type': 'text/plain' });
res.end('Hello, World!\n');
});Example 37 shows the updates to make to the Packer template:
Example 37. Update the Packer template (ch3/packer/sample-app.pkr.hcl)
build {
sources = ["source.amazon-ebs.amazon-linux"]
provisioner "file" {
sources = ["sample-app"] (1)
destination = "/tmp/"
}
provisioner "shell" {
script = "install-node.sh"
pause_before = "30s"
}
}There is just one change in the Packer template:
| 1 | Copy the sample-app folder onto the server. Note that you initially copy it into the /tmp folder; you’ll update the install-node.sh script shortly to move it to its final destination. |
Update install-node.sh as shown in Example 38:
Example 38. Update install-node.sh (ch3/packer/install-node.sh)
#!/usr/bin/env bash
set -e
sudo tee /etc/yum.repos.d/nodesource-nodejs.repo > /dev/null <<EOF
[nodesource-nodejs]
baseurl=https://rpm.nodesource.com/pub_23.x/nodistro/nodejs/x86_64
gpgkey=https://rpm.nodesource.com/gpgkey/ns-operations-public.key
EOF
sudo yum install -y nodejs
sudo adduser app-user (1)
sudo mv /tmp/sample-app /home/app-user (2)
sudo chown -R app-user /home/app-user/sample-app (3)
sudo npm install pm2@latest -g (4)
eval "$(sudo -u app-user pm2 startup -u app-user | tail -n1)" (5)These are the same security and reliability improvements you did in the server orchestration section:
| 1 | Create app-user. This will also automatically create a home folder for app-user. |
| 2 | Move the sample-app folder from the /tmp folder to `app-user’s home folder. |
| 3 | Make the app-user the owner of the sample-app folder. |
| 4 | Install PM2. |
| 5 | Configure PM2 to run on boot (as app-user). |
To build the AMI, authenticate to AWS, and run the following:
$ cd ch3/packer
$ packer init sample-app.pkr.hcl
$ packer build sample-app.pkr.hclWhen the build is done, Packer will output the ID of the newly created AMI, which you will deploy in the next section.
Example: Deploy a VM Image in an Auto Scaling Group Using OpenTofu
The next step is to deploy the AMI. In Part 2, you used OpenTofu to deploy an AMI on a single EC2 instance. The goal now is to see VM orchestration at play, which means deploying a cluster with multiple servers. Most cloud providers offer a native way to run VMs across a cluster: AWS offers Auto Scaling Groups (ASG), GCP offers Managed Instance Groups, and Azure offers Scale Sets (full list). For this example, you’ll be using an AWS ASG.
Let’s use a reusable OpenTofu module called asg from this blog post series’s
sample code repo to deploy the ASG. You can find the module in the ch3/tofu/modules/asg
folder. This is a simple module that creates three main resources:
-
A launch template, which is a bit like a blueprint that specifies the configuration to use for each EC2 instance.
-
An ASG which uses the configuration in the launch template to stamp out EC2 instances. The ASG will deploy these instances into the Default VPC (see A Note on Default Virtual Private Clouds).
-
A security group that controls what traffic can go in and out of the instances.
|
A Note on Default Virtual Private Clouds
Most of the AWS examples in this blog post series use the Default VPC. A VPC, or virtual private cloud, is an isolated area of your AWS account that has its own virtual network and IP address space. Many AWS resources, such as EC2 instances, deploy into a VPC. If you don’t explicitly specify a VPC, the resource will be deployed into the Default VPC, which is fine for learning and testing, but not for production; you’ll learn how to create a custom VPC for production in Part 7. |
To use the asg module, create a live/asg-sample folder to act as a root module:
$ cd fundamentals-of-devops
$ mkdir -p ch3/tofu/live/asg-sample
$ cd ch3/tofu/live/asg-sampleInside this folder, create main.tf with the contents shown in Example 39:
Example 39. Configure the
asg module (ch3/tofu/live/asg-sample/main.tf)provider "aws" {
region = "us-east-2"
}
module "asg" {
source = "brikis98/devops/book//modules/asg"
version = "1.0.0"
name = "sample-app-asg" (1)
ami_name = "sample-app-packer-*" (2)
user_data = filebase64("${path.module}/user-data.sh") (3)
app_http_port = 8080 (4)
instance_type = "t2.micro" (5)
min_size = 3 (6)
max_size = 10 (7)
}The preceding code sets the following parameters:
| 1 | name: The name to use for the launch template, ASG, etc. |
| 2 | ami_name: The name of the AMI to use for each EC2 instance. The preceding code sets this to the name of the AMI
you built from the Packer template in the previous section. |
| 3 | user_data: The user data script to run on each instance during boot. The contents of user-data.sh are shown in
Example 40. |
| 4 | app_http_port: The port to open in the security group to allow the app to receive HTTP requests. |
| 5 | instance_type: The type of instances to run in the ASG. |
| 6 | min_size: The minimum number of instances to run in the ASG. |
| 7 | max_size: The maximum number of instances to run in the ASG. |
Create a file called user-data.sh with the contents shown in Example 40:
Example 40. The user data script (ch3/tofu/live/asg-sample/user-data.sh)
#!/usr/bin/env bash
set -e
su app-user <<'EOF'
cd /home/app-user/sample-app
pm2 start app.config.js
pm2 save
EOFThis user data script switches to app-user, goes into the sample-app folder where Packer copied the sample app
code, uses PM2 to run the sample app, and then saves the sample app to the list of apps that should be restarted
after a reboot.
If you were to run apply right now, you’d get an ASG with three EC2 instances running your sample app. While this is
great for redundancy, as discussed in the server orchestration section, you typically want to give your users just a
single endpoint to hit. This requires deploying a load balancer, as described in the next section.
Example: Deploy an Application Load Balancer Using OpenTofu
In the server orchestration section, you deployed your own load balancer using Nginx. One of the benefits of the cloud is that you can use managed services to solve common problems such as load balancing: e.g., AWS offers Elastic Load Balancers (ELB), GCP offers Cloud Load Balancers, and so on. Load balancer services such as AWS ELBs have a number of advantages over the simplified Nginx deployment you did earlier:
- Availability
-
AWS automatically deploys multiple servers for an ELB, so you don’t get an outage if one server crashes.
- Scalability
-
AWS automatically scales the number of ELB servers up and down in response to load.
- Maintenance
-
AWS automatically keeps the load balancer up to date, with zero downtime.
- Security
-
AWS load balancers are hardened against a variety of attacks, including meeting the requirements of a number of security standards (e.g., SOC 2, ISO 27001, HIPAA, PCI-DSS).
- Encryption
-
AWS ELBs make it easy to encrypt data in transit using HTTPS and TLS (which you’ll learn about in Part 8).
To be clear, you can do all of this with Nginx, too, but it’s a considerable amount of work. Using a managed service for load balancing can be a huge time saver, so let’s use an AWS ELB. There are actually several types of AWS ELBs; the one that’ll be the best fit for the simple sample app is the Application Load Balancer (ALB).
The blog post series’s sample code repo includes a module called alb in the ch3/tofu/modules/alb folder that you
can use to deploy an ALB. It’s a simple module that deploys the ALB into the Default VPC and
configures it to forward all requests to your servers, which should suffice for this blog post.
Example 41 shows how to update the asg-sample module to use the alb module:
Example 41. Use the
alb module (ch3/tofu/live/asg-sample/main.tf)module "asg" {
source = "brikis98/devops/book//modules/asg"
version = "1.0.0"
# ... (other params omitted) ...
}
module "alb" {
source = "brikis98/devops/book//modules/alb"
version = "1.0.0"
name = "sample-app-alb" (1)
alb_http_port = 80 (2)
app_http_port = 8080 (3)
app_health_check_path = "/" (4)
}The preceding code sets the following parameters on the alb module:
| 1 | name: The name to use for the ALB and all other resources. |
| 2 | alb_http_port: The port the ALB will listen on for HTTP requests. |
| 3 | app_http_port: The port the app will listen on for HTTP requests. The ALB will send traffic to this port. It will
also perform health checks on this port, sending each server a request every 30 seconds, and only considering the
server as healthy (and therefore, routing traffic to it) if it returns a 200 OK. |
| 4 | app_health_check_path: The path to use in the app for health checks. |
There is one piece missing: how does the ALB know which EC2 instances to send traffic to? To connect the ALB and ASG, make the changes shown in Example 42:
Example 42. Update the
asg module (ch3/tofu/live/asg-sample/main.tf)module "asg" {
source = "brikis98/devops/book//modules/asg"
version = "1.0.0"
# ... (other params omitted) ...
target_group_arns = [module.alb.target_group_arn]
}Setting target_group_arns will change the ASG behavior in the following ways:
- Auto registration
-
The ASG will now register its instances with the ALB, including the initial instances from when you launch the ASG, as well as any instances that launch later (e.g., as a result of a deployment, auto healing, or auto scaling).
- Auto healing
-
By default, the auto healing feature in the ASG only replaces an instance if it has crashed (a hardware issue), but if it’s the app that crashed (a software issue), and the instance is still running, the ASG won’t know to replace it. Setting the
target_group_arnsparameter configures the ASG to use the ALB for health checks, so auto healing will handle both hardware and software issues.
The final change to the asg-sample module is to add the load balancer’s domain name as an output variable in
outputs.tf, as shown in Example 43:
Example 43. Output the ALB domain name (ch3/tofu/live/asg-sample/outputs.tf)
output "alb_dns_name" {
description = "The ALB's domain name"
value = module.alb.alb_dns_name
}To deploy the module, authenticate to AWS, and run the following commands:
$ tofu init
$ tofu applyWhen apply completes, you should see the ALB domain name as an output:
Apply complete! Resources: 10 added, 0 changed, 0 destroyed.


Outputs:


alb_dns_name = "sample-app-tofu-656918683.us-east-2.elb.amazonaws.com"
Open this domain name in your web browser, and you should see "Hello, World!" once again. Congrats, you now have a single endpoint, the load balancer domain name, that you can give your users, and when users hit it, the load balancer will distribute their requests across all the apps in your ASG!
You’ve now seen the initial deployment with VM orchestration, but what about rolling out updates? This is the topic of the next section.
Example: Roll Out Updates with OpenTofu and Auto Scaling Groups
Most VM orchestration tools have support for zero-downtime deployment. For example, AWS ASGs support rolling
deployments through a feature called
instance refresh.
Example 44 shows how to enable instance refresh in the asg module:
Example 44. Enable instance refresh (ch3/tofu/live/asg-sample/main.tf)
module "asg" {
source = "brikis98/devops/book//modules/asg"
version = "1.0.0"
# ... (other params omitted) ...
instance_refresh = {
min_healthy_percentage = 100 (1)
max_healthy_percentage = 200 (2)
auto_rollback = true (3)
}
}The preceding code sets the following parameters:
| 1 | min_healthy_percentage: Setting this to 100% means that the cluster will never have fewer than the desired number
of instances (initially, three), even during deployment. Whereas with server orchestration, you updated instances in
place, with VM orchestration, you’ll deploy new instances, as per the next parameter. |
| 2 | max_healthy_percentage: Setting this to 200% means that to deploy updates, the cluster will deploy totally new
instances, up to twice the original size of the cluster, wait for the new instances to pass health checks, and then
undeploy the old instances. So if you started with three instances, then during deployment, you’ll go up to six
instances, with three new and three old, and when the new instances pass health checks, you’ll go back to three
instances by undeploying the old ones. |
| 3 | auto_rollback: If something goes wrong during deployment, and the new instances fail to pass health checks, this
setting will automatically initiate a rollback, putting your cluster back to its previous working condition. |
Run apply one more time to enable the instance refresh setting. Once that’s done, you can try rolling out a change.
For example, update app.js in the packer folder to respond with "Fundamentals of DevOps!", as shown in
Example 45:
Example 45. Update the app response text (ch3/packer/sample-app/app.js)
res.end('Fundamentals of DevOps!\n');Next, in the ch3/packer folder, build a new AMI:
$ packer build sample-app.pkr.hclWhen the Packer build is complete, go back to the asg-sample module and run apply again. The module will
automatically find the newly-built AMI, and you should then see a plan output that looks like this:
$ tofu apply
OpenTofu will perform the following actions:
# aws_autoscaling_group.sample_app will be updated in-place
~ resource "aws_autoscaling_group" "sample_app" {
~ launch_template {
~ version = "1" -> (known after apply)
}
}
# aws_launch_template.sample_app will be updated in-place
~ resource "aws_launch_template" "sample_app" {
~ image_id = "ami-0f5b3d9c244e6026d" -> "ami-0d68b7b6546331281"
~ latest_version = 1 -> (known after apply)
}This plan output shows that the launch template has changed, due to the new AMI ID, and as a result, the version of the
launch template used in the ASG has changed. This will result in an instance refresh. Type in yes, hit Enter, and
AWS will kick off the instance refresh process in the background. If you go to the EC2 Console, click Auto Scaling
Groups in the left nav, find your ASG, and click the "Instance refresh" tab, you should be able to see the instance
refresh in progress, as shown in Figure 23.
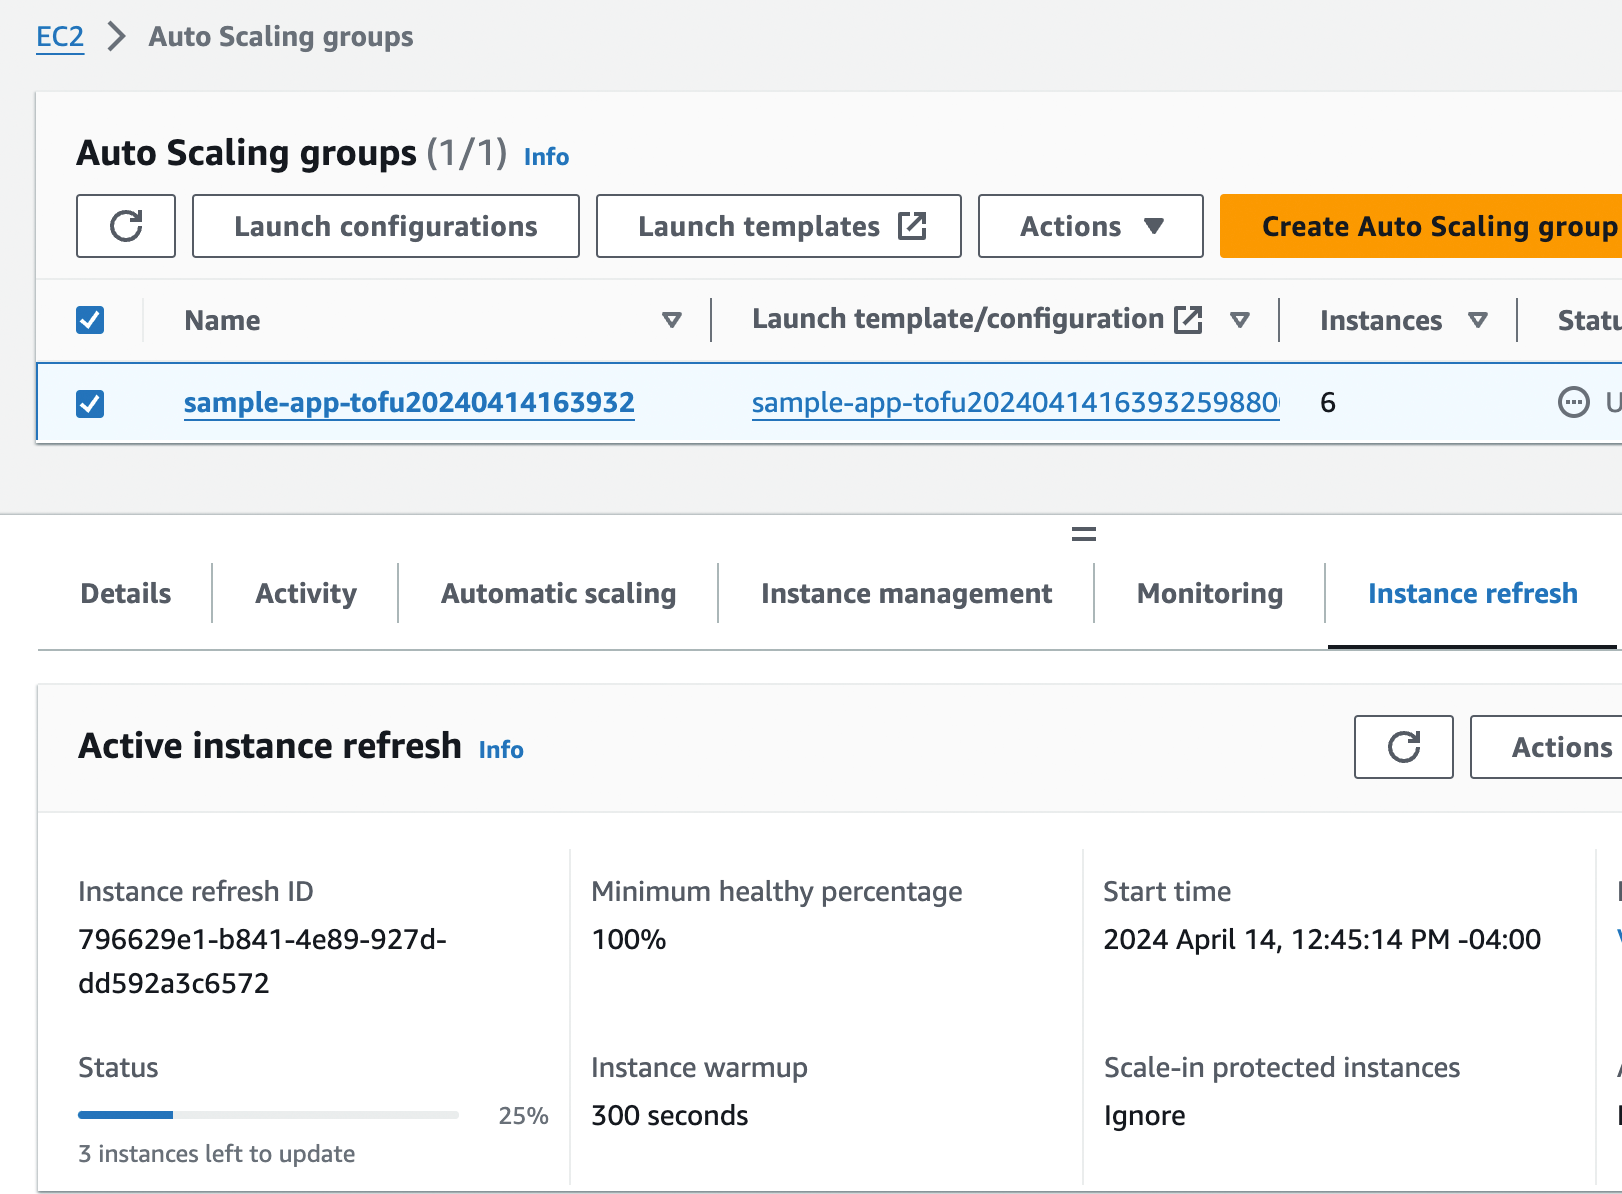
Figure 23. Using the EC2 console to see an ASG instance refresh in progress
During this process, the ASG will launch three new EC2 instances, and the ALB will start performing health checks on them. Once the new instances start to pass health checks, the ASG will undeploy the old instances, leaving you with just the three new instances running the new code. The whole process should take around five minutes.
During this deployment, the load balancer URL should always return a successful response, as this is a zero-downtime
deployment. You can even check this by opening a new terminal tab, and running the following Bash one-liner (make sure
to replace <LOAD_BALANCER_URL> with your load balancer URL):
$ while true; do curl http://<LOAD_BALANCER_URL>; sleep 1; doneThis code runs curl, an HTTP client, in a loop, hitting your ALB once per second and allowing you to see the
zero-downtime deployment in action. For the first couple minutes, you should see only "Hello, World!" responses from
the old instances. Then, as new instances start to pass health checks, the ALB will begin sending traffic to them, and
you should see the response from the ALB alternate between "Hello, World!" and "Fundamentals of DevOps!" After another
couple minutes, the "Hello, World!" message will disappear, and you’ll see only "Fundamentals of DevOps!", which means
all the old instances have been shut down. The output will look something like this:
Hello, World!

Hello, World!

Hello, World!

Hello, World!

Hello, World!

Hello, World!

Fundamentals of DevOps!

Hello, World!

Fundamentals of DevOps!

Hello, World!

Fundamentals of DevOps!

Hello, World!

Fundamentals of DevOps!

Hello, World!

Fundamentals of DevOps!

Hello, World!

Fundamentals of DevOps!

Fundamentals of DevOps!

Fundamentals of DevOps!

Fundamentals of DevOps!

Fundamentals of DevOps!
Congrats, you’ve now seen VM orchestration in action, including rolling out changes following immutable infrastructure practices!
|
Get your hands dirty
Here are a few exercises you can try at home to go deeper:
|
When you’re done experimenting with the ASG, run tofu destroy to undeploy all your infrastructure.
You’ve now seen server and VM orchestration, and how they compare. To give you one more comparison point, let’s move on to container orchestration.
Container Orchestration
The idea with container orchestration is to do the following:
-
Create container images that have your apps and all their dependencies fully installed and configured.
-
Deploy the container images across a cluster of servers, with potentially multiple containers per server, packed in as efficiently as possible (bin packing).
-
Automatically scale the number of servers or the number of containers up or down, depending on load.
-
When you need to deploy an update, create new container images, deploy them into the cluster, and then undeploy the old containers.
Although containers have been around for decades, container orchestration started to explode in popularity around 2013, with the emergence of Docker, a tool for building, running, and sharing containers, and Kubernetes, a container orchestration tool. The reason for this popularity is that containers and container orchestration offer a number of advantages over VMs and VM orchestration:
- Speed
-
Containers typically build faster than VMs, especially with caching, and container orchestration tools typically deploy faster than VMs. While the build & deploy cycle with VMs takes 5-30 minutes, with containers, it’s just 1-5 minutes.
- Efficiency
-
Most container orchestration tools have a built-in scheduler to decide which servers in your cluster should run which containers, using bin packing algorithms to use the available resources as efficiently as possible.[12]
- Portability
-
Containers and container orchestration are supported just about everywhere, including on-prem and in all the major cloud providers. Moreover, the most popular container tools, Docker and Kubernetes, are both open source.
- Local development
-
Running VMs for local development is relatively rare, as VM images are fairly heavyweight (large file sizes, slow boot times, CPU and memory overhead), and there is no practical way to run most VM orchestration tools locally (e.g., there’s no way to deploy an AWS ASG on your own computer). On the other hand, running containers in your local development environment is fairly common, as containers are more lightweight (smaller file sizes, faster boot, less CPU and memory overhead), and it’s easy to run container orchestration tools locally (you’ll see an example of running Kubernetes locally shortly).
- Functionality
-
Container orchestration tools solved more orchestration problems out-of-the-box than VM orchestration tools. For example, Kubernetes has built-in solutions for deployment, updates, auto scaling, auto healing, configuration, secrets management, service discovery, and disk management.
|
Key takeaway #3
Container orchestration is an immutable infrastructure approach where you deploy and manage container images across a cluster of servers. |
There are many container tools out there, as you saw in Part 2, such as Docker, Moby, CRI-O, and Podman. Likewise, there are many container orchestration tools out there, including Kubernetes, Nomad, Amazon ECS, and OpenShift (full list). The most popular, by far, are Docker and Kubernetes—so much so their names are nearly synonymous with containers and container orchestration, respectively—so that’s what we’ll focus on in this blog post series.
In the next several sections, you’ll learn to use Docker, followed by Kubernetes, and finally, you’ll learn to use Docker and Kubernetes in AWS. Let’s get into it!
Example: A Crash Course on Docker
First, install Docker Desktop (minimum version 4.0). Once it’s installed, you
should have the docker command available on your command line. You can use the docker run command to run Docker
images locally:
$ docker run <IMAGE> [COMMAND]where IMAGE is the Docker image to run and COMMAND is an optional command to execute. For example, here’s how you
can run a Bash shell in an Ubuntu 24.04 Docker image (the -it flag enables an interactive shell):
$ docker run -it ubuntu:24.04 bash
Unable to find image 'ubuntu:24.04' locally
24.04: Pulling from library/ubuntu
Digest: sha256:3f85b7caad41a95462cf5b787d8a04604c
Status: Downloaded newer image for ubuntu:24.04
root@d96ad3779966:/#And voilà, you’re now in Ubuntu! If you’ve never used Docker before, this can seem fairly magical. Try running some commands. For example, you can look at the contents of /etc/os-release to verify you really are in Ubuntu:
root@d96ad3779966:/# cat /etc/os-release

PRETTY_NAME="Ubuntu 24.04 LTS"

(...)
How did this happen? Well, first, Docker searches its local cache for the ubuntu:24.04 image. If you don’t
have that image downloaded already, Docker downloads it automatically from Docker Hub, which
is a Docker Registry that contains shared Docker images. The ubuntu:24.04 image happens to be a public Docker
image—an official one maintained by the Docker team—so you’re able to download it without any authentication. It’s also
possible to create private Docker images that only certain authenticated users can use, as you’ll see later in this
blog post.
Once the image is downloaded, Docker runs the image, executing the bash command, which starts an interactive Bash
prompt, where you can type. Try running the ls command to see the list of files:
root@d96ad3779966:/# ls -al

total 56

drwxr-xr-x   1 root root 4096 Feb 22 14:22 .

drwxr-xr-x   1 root root 4096 Feb 22 14:22 ..

lrwxrwxrwx   1 root root    7 Jan 13 16:59 bin -> usr/bin

drwxr-xr-x   2 root root 4096 Apr 15  2020 boot

drwxr-xr-x   5 root root  360 Feb 22 14:22 dev

drwxr-xr-x   1 root root 4096 Feb 22 14:22 etc

drwxr-xr-x   2 root root 4096 Apr 15  2020 home

lrwxrwxrwx   1 root root    7 Jan 13 16:59 lib -> usr/lib

(...)
You might notice that’s not your filesystem. That’s because Docker images run in containers that are isolated at the userspace level. When you’re in a container, you can only see the filesystem, memory, networking, etc., in that container. Any data in other containers, or on the underlying host operating system, is not accessible to you. This is one of the things that makes Docker useful for running applications: the image format is self-contained, so Docker images run the same way no matter where you run them, and no matter what else is running there. To see this in action, write some text to a test.txt file as follows:
root@d96ad3779966:/# echo "Hello, World!" > test.txt
Next, exit the container by hitting Ctrl-D, and you should be back in your original command prompt on your underlying host OS. If you try to look for the test.txt file you just wrote, you’ll see that it doesn’t exist; the container’s filesystem is totally isolated from your host OS.
Now, try running the same Docker image again:
$ docker run -it ubuntu:24.04 bash
root@3e0081565a5d:/#Notice that this time, since the ubuntu:24.04 image is already downloaded, the container starts almost instantly.
This is another reason Docker is useful for running applications: unlike virtual machines, containers are lightweight,
boot up quickly, and incur little CPU or memory overhead.
You may also notice that the second time you fired up the container, the command prompt looked different. That’s
because you’re now in a totally new container, and any data you wrote in the previous one is no longer accessible to
you. Run ls -al and you’ll see that the test.txt file does not exist. Containers are isolated not only from the
host OS but also from each other.
Hit Ctrl-D again to exit the container, and back on your host OS, run docker ps:
$ docker ps -a
CONTAINER ID IMAGE COMMAND CREATED STATUS
3e0081565a5d ubuntu:24.04 "bash" 5 min ago Exited (0) 16 sec ago
d96ad3779966 ubuntu:24.04 "bash" 14 min ago Exited (0) 5 min agoThis will show you all the containers on your system, including the stopped ones (the ones you exited). You can start
a stopped container again by using the docker start <ID> command, setting ID to an ID from the CONTAINER ID column
of the docker ps output. For example, here is how you can start the first container up again (and attach an
interactive shell to it via the -ia flags):
$ docker start -ia d96ad3779966
root@d96ad3779966:/#You can confirm this is really the first container by outputting the contents of test.txt:
root@d96ad3779966:/# cat test.txt

Hello, World!
Hit Ctrl-D once more to exit the container and get back to your host OS.
Now that you’ve seen the basics of Docker, let’s look at what it takes to create your own Docker images, and use them to run web apps.
Example: Create a Docker Image for a Node.js app
Let’s see how a container can be used to run a web app: in particular, the Node.js sample app you’ve been using throughout this blog post series. Create a new folder called docker:
$ cd fundamentals-of-devops
$ mkdir -p ch3/docker
$ cd ch3/dockerCopy app.js from the server orchestration section into the docker folder (note: you do not need to copy app.config.js this time):
$ cp ../ansible/roles/sample-app/files/app.js .If you had updated app.js to respond with "Fundamentals of DevOps!" to test out rolling deployments with Ansible, change the response text back to "Hello, World!" in ch3/docker/app.js.
Next, create a file called Dockerfile, with the contents shown in Example 46:
Example 46. Dockerfile for the Node.js sample-app (ch3/docker/Dockerfile)
(1)
FROM node:21.7
(2)
WORKDIR /home/node/app
(3)
COPY app.js .
(4)
EXPOSE 8080
(5)
USER node
(6)
CMD ["node", "app.js"]Just as you used a Packer template to define how to build a VM image for your sample app, this Dockerfile is a template that defines how to build a Docker image for your sample app. This Dockerfile does the following:
| 1 | It starts with the official Node.js Docker image from Docker Hub as the base. One of the advantages of Docker is that it’s easy to share Docker images, so instead of having to figure out how to install Node.js yourself, you can use the official image, which is maintained by the Node.js team. |
| 2 | Set the working directory for the rest of the build. |
| 3 | Copy app.js into the Docker image. |
| 4 | This tells the Docker image to advertise that the app within it will listen on port 8080. When someone uses your Docker image, they can use this information to know what ports to forward. You’ll see an example of this shortly. |
| 5 | Use the node user (created as part of the official Node.js Docker image) instead of the root user when running
this app. |
| 6 | When you run the Docker image, this will be the default command that it executes. Note that you typically do not
need to use a process supervisor for Docker images, as most container orchestration tools automatically supervise
the container processes they run. Also note that just about all container orchestration tools expect your
containers to run apps in the "foreground," blocking until they exit, and logging directly to stdout and stderr. |
To build a Docker image from this Dockerfile, use the docker build command:
$ docker build -t sample-app:v1 .The -t flag is the tag (name) to use for the Docker image. The preceding code sets the image name to "sample-app" and
the version to "v1." Later on, if you make changes to the sample app, you’ll be able to build a new Docker image and
give it a new version, such as "v2." The dot (.) at the end specifies the current directory (which should be the
folder that contains your Dockerfile) as the build context, which is how you tell Docker what set of files it can
access for the build. When the build finishes, you can use the docker run command to run your new image (with
the -it and --init flags to ensure CTRL+C works correctly):
$ docker run -it --init sample-app:v1
Listening on port 8080Your app is now listening on port 8080! However, if you open a new terminal on your host operating system and try to access the sample app, it won’t work:
$ curl localhost:8080
curl: (7) Failed to connect to localhost port 8080: Connection refusedWhat’s the problem? Actually, it’s not a problem but a feature! Docker containers are isolated from the host operating
system and other containers, not only at the filesystem level but also in terms of networking. So while the container
really is listening on port 8080, that is only on a port inside the container, which isn’t accessible on the host OS.
If you want to expose a port from the container on the host OS, you have to do it via the -p flag.
First, hit Ctrl-C to shut down the sample-app container. Note that it’s Ctrl-C this time, not Ctrl-D, as you’re
shutting down a process, rather than exiting an interactive prompt. Now rerun the container, but this time with the
-p flag as follows:
$ docker run -p 8080:8080 -it --init sample-app:v1
Listening on port 8080Adding -p 8080:8080 to the command tells Docker to expose port 8080 inside the container on port 8080 of the host OS.
You know to use port 8080 here, as you built this Docker image yourself, but if this was someone else’s image, you
could use docker inspect on the image, and that will tell you about any ports that image labeled with EXPOSE.
In another terminal on your host OS, you should now be able to see the sample app working:
$ curl localhost:8080
Hello, World!Congrats, you now know how to run a web app locally using Docker! However, while using docker run directly is fine
for local testing and learning, it’s not the way you’d run Dockerized apps in production. For that, you typically want
to use a container orchestration tool such as Kubernetes, which is the topic of the next section.
|
Cleaning Up Containers
Every time you use |
Example: Deploy a Dockerized App with Kubernetes
Kubernetes (sometimes referred to as K8S) is a container orchestration tool, which means it’s a platform for running and managing containers on your servers, including scheduling, auto healing, auto scaling, load balancing, and more. Under the hood, Kubernetes consists of two main pieces, as shown in Figure 24:
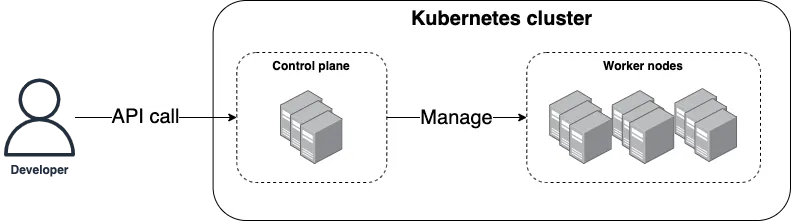
Figure 24. The Kubernetes architecture consists of a control plane and worker nodes
- Control plane
-
The control plane is responsible for managing the Kubernetes cluster. It is the "brains" of the operation, responsible for storing the state of the cluster, monitoring containers, and coordinating actions across the cluster. It also runs the API server, which provides an API you can use from command-line tools (e.g.,
kubectl), web UIs (e.g., the Kubernetes Dashboard), and IaC tools (e.g., OpenTofu) to control what’s happening in the cluster. - Worker nodes
-
The worker nodes are the servers used to actually run your container workloads. The worker nodes are entirely managed by the control plane, which tells each worker node what containers it should run.
Kubernetes is open source, and one of its strengths is that you can run it anywhere: in any cloud, on-prem, and even on your personal computer. A little later in this blog post, you’ll run Kubernetes in the cloud (in AWS), but for now, let’s start small and run it locally. This is easy to do if you installed a relatively recent version of Docker Desktop, as it has Kubernetes built-in. Open Docker Desktop’s preferences, and you should see Kubernetes in the nav, as shown in Figure 25.
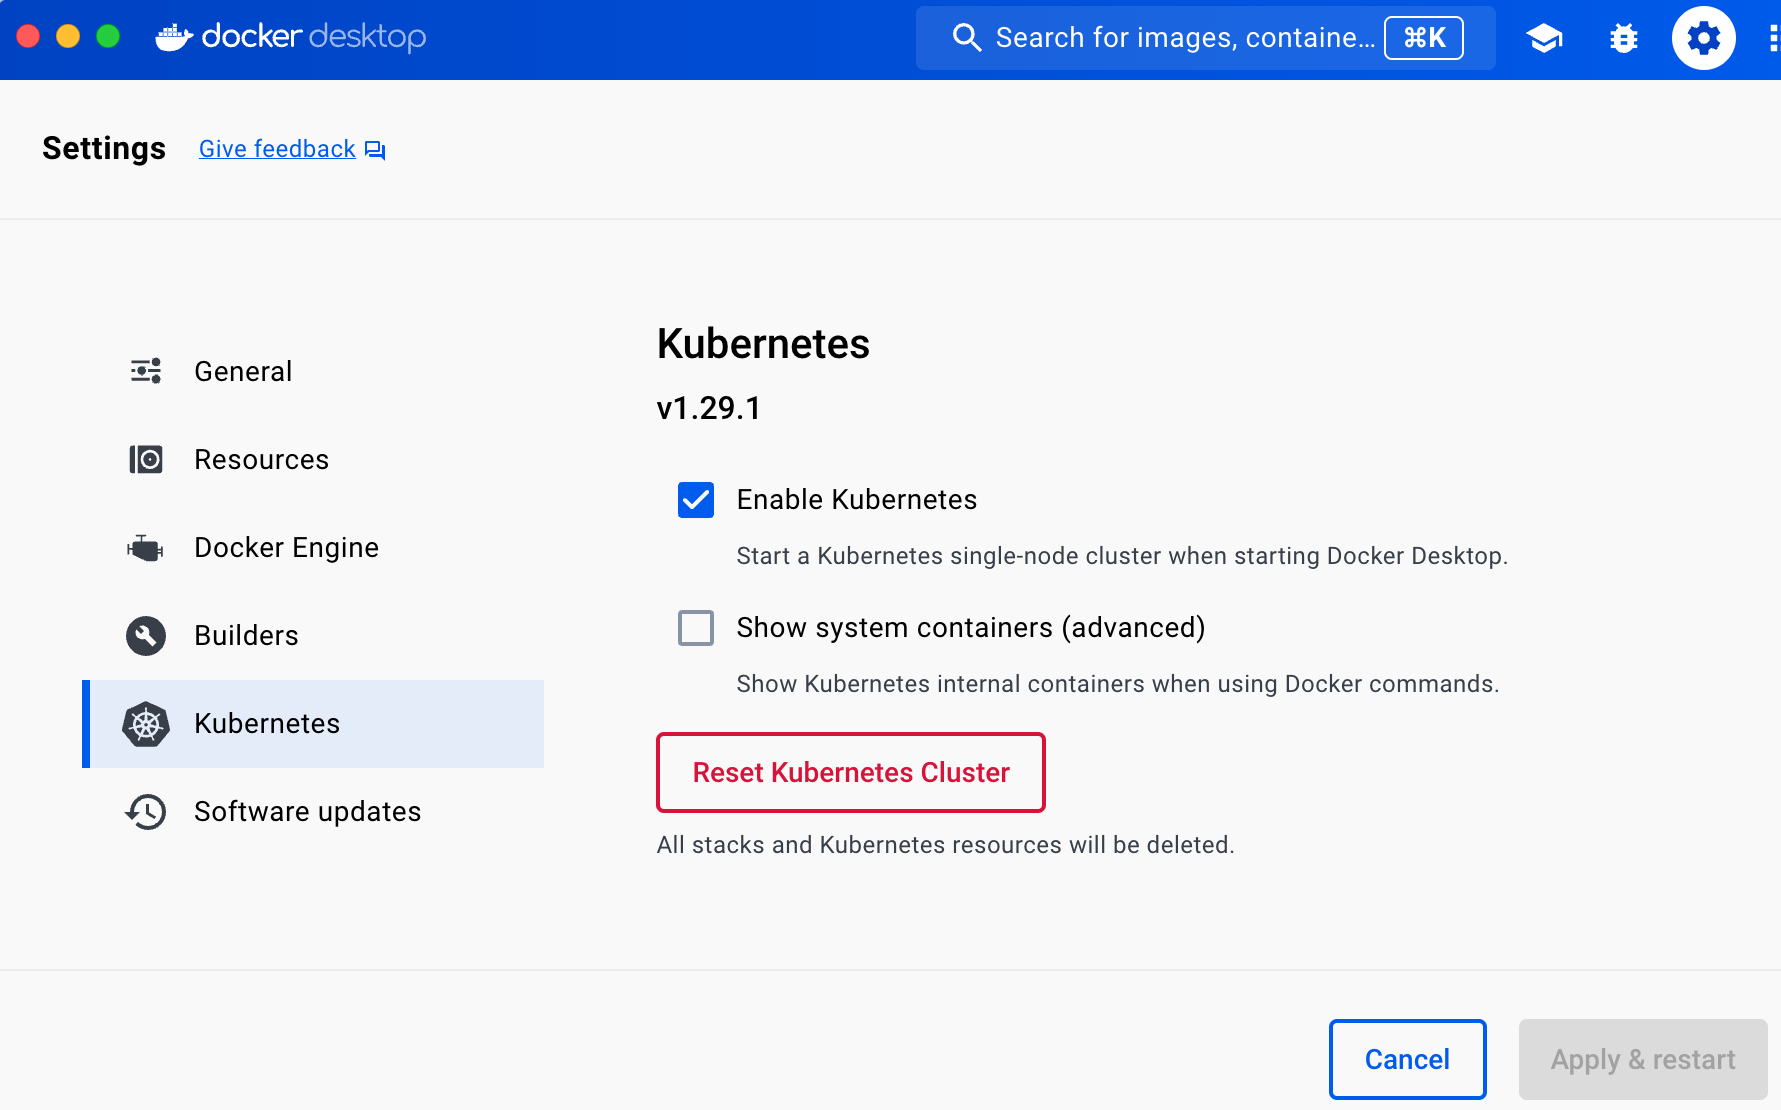
Figure 25. Enable Kubernetes on Docker Desktop.
Check the Enable Kubernetes checkbox, click Apply & Restart, and wait a few minutes for that to complete.
In the meantime, install kubectl (minimum version 1.30), which is the
command-line tool for interacting with Kubernetes. To use kubectl, you must first update its configuration file,
which lives in $HOME/.kube/config (that is, the .kube folder of your home directory), to tell it what Kubernetes
cluster to connect to. Conveniently, when you enable Kubernetes in Docker Desktop, it updates this config file for you,
adding a docker-desktop entry to it, so all you need to do is tell kubectl to use this configuration as follows:
$ kubectl config use-context docker-desktop
Switched to context "docker-desktop".Now you can use get nodes to check if your Kubernetes cluster is working:
$ kubectl get nodes
NAME STATUS ROLES AGE VERSION
docker-desktop Ready control-plane 2m31s v1.32.0The get nodes command shows you information about all the nodes in your cluster. Since you’re running Kubernetes
locally, your computer is the only node, and it’s running both the control plane and acting as a worker node. You’re
now ready to run some Docker containers.
To deploy something in Kubernetes, you create Kubernetes objects, which are persistent entities you write to the Kubernetes cluster (via the API server) that record your intent: e.g., your intent to have specific Docker images running. The cluster runs a reconciliation loop, which continuously checks the objects you stored in it and works to make the state of the cluster match your intent.
There are many different types of Kubernetes objects available. The one we’ll use to deploy your sample app is a Kubernetes Deployment, which is a declarative way to manage an application in Kubernetes. The Deployment allows you to declare what Docker images to run, how many copies of them to run (replicas), a variety of settings for those images (e.g., CPU, memory, port numbers, environment variables), and so on, and the Deployment will then work to ensure that the requirements you declared are always met.
One way to interact with Kubernetes is to create YAML files to define your Kubernetes objects, and to use the
kubectl apply command to submit those objects to the cluster. Create a new folder called kubernetes to store these
YAML files:
$ cd fundamentals-of-devops
$ mkdir -p ch3/kubernetes
$ cd ch3/kubernetesWithin the kubernetes folder, create a file called sample-app-deployment.yml with the contents shown in Example 47:
Example 47. K8S Deployment (ch3/kubernetes/sample-app-deployment.yml)
apiVersion: apps/v1
kind: Deployment (1)
metadata: (2)
name: sample-app-deployment
spec:
replicas: 3 (3)
template: (4)
metadata: (5)
labels:
app: sample-app-pods
spec:
containers: (6)
- name: sample-app (7)
image: sample-app:v1 (8)
ports:
- containerPort: 8080 (9)
env: (10)
- name: NODE_ENV
value: production
selector: (11)
matchLabels:
app: sample-app-podsThis YAML file gives you a lot of functionality for just ~20 lines of code:
| 1 | The kind keyword specifies that this Kubernetes object is a Deployment. |
| 2 | Every Kubernetes object includes metadata that can be used to identify and target that object in API calls. Kubernetes makes heavy use of metadata and labels to keep the system highly flexible and loosely coupled. The preceding code sets the name of the Deployment to "sample-app-deployment." |
| 3 | The Deployment will run 3 replicas. |
| 4 | This is the pod template—the blueprint—that defines what this Deployment will deploy and manage. It’s similar to
the launch template you saw with AWS ASGs. In Kubernetes, instead of deploying one container at a time, you deploy
pods, which are groups of containers that are meant to be deployed together. For example, you could have a pod
with one container to run a web app (e.g., the sample app) and another container that gathers metrics on the web
app and sends them to a central service (e.g., Datadog). So this template block allows you to configure your
pods, specifying what container(s) to run, the ports to use, environment variables to set, and so on. |
| 5 | Templates can be used separately from Deployments, so they have separate metadata which allows you to identify and target that template in API calls (this is another example of Kubernetes trying to be highly flexible and decoupled). The preceding code sets the "app" label to "sample-app-pods." |
| 6 | Inside the pod template, you define one or more containers to run in that pod. |
| 7 | This example configures just a single container to run, called "sample-app." |
| 8 | Configure the container to run the Docker image you built earlier. |
| 9 | This tells Kubernetes that the Docker image listens for requests on port 8080. |
| 10 | Set environment variables for the container. The preceding code sets the NODE_ENV environment variable to
"production." |
| 11 | Since Deployments and templates can be defined completely separately, you need to specify a
selector to tell the Deployment what pod to target (this is yet another example of Kubernetes trying to be
flexible and decoupled). |
Use the kubectl apply command to apply your Deployment configuration:
$ kubectl apply -f sample-app-deployment.yml
deployment.apps/sample-app-deployment createdThis command should complete nearly instantaneously. How do you know if it actually worked? To answer that question, you
can use kubectl to explore your cluster. First, run the get deployments command, and you should see your Deployment:
$ kubectl get deployments
NAME READY UP-TO-DATE AVAILABLE AGE
sample-app-deployment 3/3 3 3 1mHere, you can see how Kubernetes uses metadata, as the name of the Deployment (sample-app-deployment) comes from your
metadata block. You can use that metadata in API calls. For example, to get more details about a specific
Deployment, run describe deployment <NAME>, where <NAME> is the name from the metadata:
$ kubectl describe deployment sample-app-deployment
Name: sample-app-deployment
CreationTimestamp: Mon, 15 Apr 2024 12:28:19 -0400
Selector: app=sample-app-pods
Replicas: 3 desired | 3 updated | 3 total | 3 available
StrategyType: RollingUpdate
MinReadySeconds: 0
RollingUpdateStrategy: 0 max unavailable, 3 max surge
(... truncated for readability ...)This Deployment is reporting that all 3 replicas are available. To see those replicas, run the get pods command:
$ kubectl get pods
NAME READY STATUS RESTARTS AGE
sample-app-deployment-64f97797fb-hcskq 1/1 Running 0 4m23s
sample-app-deployment-64f97797fb-p7zjk 1/1 Running 0 4m23s
sample-app-deployment-64f97797fb-qtkl8 1/1 Running 0 4m23sAnd to get the details about a specific pod, copy its name, and run describe pod:
$ kubectl describe pod sample-app-deployment-64f97797fb-hcskq
Name: sample-app-deployment-64f97797fb-hcskq
Node: docker-desktop/192.168.65.3
Start Time: Mon, 15 Apr 2024 14:08:04 -0400
Labels: app=sample-app-pods
pod-template-hash=64f97797fb
Status: Running
IP: 10.1.0.31
Controlled By: ReplicaSet/sample-app-deployment-64f97797fb
Containers:
sample-app:
Image: sample-app:v1
Port: 8080/TCP
Host Port: 0/TCP
(... truncated for readability ...)From this output, you can see the containers that are running for each pod, which in this case, is just one container
per pod running the sample-app:v1 Docker image you built earlier. You can also see the logs for a single pod by using
the logs command, which is useful for understanding what’s going on and debugging:
$ kubectl logs sample-app-deployment-64f97797fb-hcskq
Listening on port 8080Ah, there’s that familiar log output. You now have three replicas of your sample app running. But, just as you saw with server and VM orchestration, users will want just one endpoint, so it’s time to deploy a load balancer with Kubernetes.
Example: Deploy a Load Balancer with Kubernetes
Kubernetes has built-in support for load balancing. The typical way to set it up is to make use of another Kubernetes object, called a Kubernetes Service, which is a way to expose an app running in Kubernetes as a service you can talk to over the network. Example 48 shows the YAML code for a Kubernetes service, which you should put in a file called sample-app-service.yml:
Example 48. Kubernetes Service (ch3/kubernetes/sample-app-service.yml)
apiVersion: v1
kind: Service (1)
metadata: (2)
name: sample-app-loadbalancer
spec:
type: LoadBalancer (3)
selector:
app: sample-app-pods (4)
ports:
- protocol: TCP
port: 80 (5)
targetPort: 8080 (6)Here’s what this code does:
| 1 | This Kubernetes object is a Service. |
| 2 | Set the name of the Service to "sample-app-loadbalancer." |
| 3 | Configure the Service to be a load balancer.[13] Under the hood, depending on what sort of Kubernetes cluster you’re running, and how you configure that cluster, the actual type of load balancer you get will be different. For example, if you run this code in AWS, you’ll get an AWS ELB; if you run it in GCP, you’ll get a Cloud Load Balancer; and if you run it locally, as you will shortly, you’ll get a load balancer that is built into the Kubernetes distribution in Docker Desktop. |
| 4 | Distribute traffic across the pods you defined in the Deployment. |
| 5 | The Service will receive requests on port 80, the default HTTP port. |
| 6 | The Service will forward requests to port 8080 of the pods. |
You apply the Service the same way, using kubectl apply:
$ kubectl apply -f sample-app-service.yml
service/sample-app-loadbalancer createdTo see if your service worked, use the get services command:
$ kubectl get services
NAME TYPE CLUSTER-IP EXTERNAL-IP PORT(S)
kubernetes ClusterIP 10.96.0.1 <none> 443/TCP
sample-app-loadbalancer LoadBalancer 10.111.250.21 localhost 80:30910/TCPThe first service in the list is Kubernetes itself, which you can ignore. The second is the Service you created, with
the name sample-app-loadbalancer (based on its own metadata block). You can get more details about your service
by using the describe service command:
$ kubectl describe service sample-app-loadbalancer
Name: sample-app-loadbalancer
Selector: app=sample-app-pods
Type: LoadBalancer
LoadBalancer Ingress: localhost
Port: <unset> 80/TCP
TargetPort: 8080/TCP
(... truncated for readability ...)You can see that the load balancer is listening on localhost, at port 80, so you can test it out by opening http://localhost:
$ curl http://localhost
Hello, World!Congrats, you’re now able to deploy Docker containers and load balancers with Kubernetes! But how do you roll out updates?
Example: Roll Out Updates with Kubernetes
Kubernetes Deployments have built-in support for rolling updates. Example 49 shows how
to update the spec section of the Deployment to enable rolling updates:
Example 49. Enable rolling updates (ch3/kubernetes/sample-app-deployment.yml)
spec:
# (... other params omitted for clarity ...)
strategy:
type: RollingUpdate
rollingUpdate:
maxSurge: 3
maxUnavailable: 0This configures the Deployment to do a rolling update where it can deploy up to 3 extra pods during the deployment,
similar to the instance refresh you saw with ASGs. Run apply to update the Deployment with these changes:
$ kubectl apply -f sample-app-deployment.yml
deployment.apps/sample-app-deployment configuredNow, make a change to the sample app in docker/app.js, such as returning the text "Fundamentals of DevOps!" instead of "Hello, World!", as shown in Example 50:
Example 50. Update the app response text (ch3/docker/app.js)
res.end('Fundamentals of DevOps!\n')To deploy this change, first, build a new Docker image, with v2 as the new version:
$ docker build -t sample-app:v2 .The build will likely run in less than a second. This is because Docker has a built-in
build cache, which, if used correctly, can dramatically speed up builds.
Next, open sample-app-deployment.yml one more time, and in the spec section, update the image
from sample-app:v1 to sample-app:v2, as shown in Example 51:
Example 51. Use the v2 image (ch3/kubernetes/sample-app-deployment.yml)
spec:
# (... other params omitted for clarity ...)
spec:
containers:
- name: sample-app
image: sample-app:v2Run apply one more time to deploy this change:
$ kubectl apply -f sample-app-deployment.yml
deployment.apps/sample-app-deployment configuredKubernetes will kick off the rolling update, and if you run get pods during this process, you’ll see
up to six pods running at the same time (three old, three new):
$ kubectl get pods
NAME READY STATUS RESTARTS AGE
sample-app-deployment-64f97797fb-pnh96 1/1 Running 0 15m
sample-app-deployment-64f97797fb-tmprp 1/1 Running 0 15m
sample-app-deployment-64f97797fb-xmjfl 1/1 Running 0 15m
sample-app-deployment-6c5ff6d6ff-fxqd4 1/1 Running 0 21s
sample-app-deployment-6c5ff6d6ff-hvwjx 1/1 Running 0 21s
sample-app-deployment-6c5ff6d6ff-krkcs 1/1 Running 0 21sAfter a little while, the three old pods will be undeployed, and you’ll be left with just the new ones. At that point, the load balancer will respond with the new text:
$ curl http://localhost
Fundamentals of DevOps!Congrats, you’ve done a zero-downtime rolling deployment with Kubernetes!
|
Get your hands dirty
I’m using YAML in these examples to avoid introducing extra tools, but raw YAML is not a great choice for production, as it doesn’t support variables, templating, for-loops, conditionals, and other programming language features that allow for code reuse. In production, you may instead want to try tools such as Helm, OpenTofu with the Kubernetes provider, or Kustomize (full list). |
When you’re done testing, shut down your app by running kubectl delete:
$ kubectl delete -f sample-app-deployment.yml
$ kubectl delete -f sample-app-service.ymlExample: Deploy a Kubernetes Cluster in AWS Using EKS
So far, you’ve been running Kubernetes locally, which is great for learning and testing. However, for production deployments, you’ll need to run a Kubernetes cluster on servers in a data center. Kubernetes is a complicated system that’s more or less a cloud in and of itself, and setting it up and maintaining it is a significant undertaking. Fortunately, if you’re using the cloud, most cloud providers have managed Kubernetes offerings that make this considerably simpler. The one you’ll learn to use in this blog post series is Amazon’s Elastic Kubernetes Service (EKS), which can deploy and manage the control plane and worker nodes for you.
|
Watch out for snakes: EKS is not part of the AWS free tier!
While most of the examples in this book are part of the AWS free tier, Amazon EKS is not. In particular, while the worker nodes may fall into the free tier (depending on the instance type you pick), as of June 2024, the control plane pricing is $0.10 per hour. |
The blog post series’s sample code repo contains a module called eks-cluster in the ch3/tofu/modules/eks-cluster
folder that you can use to deploy a simple EKS cluster, which includes the following:
-
A fully-managed control plane.
-
Fully-managed worker nodes. EKS supports several types of worker nodes; the
eks-clustermodule uses an EKS managed node group, which deploys worker nodes in an ASG, so you’re making use of VM orchestration in addition to container orchestration, although the VM orchestration is mostly invisible to you, as AWS handles all the details. -
IAM roles with the minimal permissions required by the control plane and worker nodes. AWS manages permissions via the Identity and Access Management (IAM) service, where you can create IAM policies, which are JSON documents that grant or deny certain permissions. In order to give the EKS control plane and worker nodes permissions to perform certain actions in your AWS account (e.g., permissions to launch EC2 instances), you create an IAM role with the corresponding IAM policy, and you allow that IAM role to be assumed by the control plane and worker nodes.
-
Everything deploys into the Default VPC.
To use the eks-cluster module, create a new folder called live/eks-sample:
$ cd fundamentals-of-devops
$ mkdir -p ch3/tofu/live/eks-sample
$ cd ch3/tofu/live/eks-sampleInside that folder, create main.tf with the contents shown in Example 52:
Example 52. Use the
eks-cluster module (ch3/tofu/live/eks-sample/main.tf)provider "aws" {
region = "us-east-2"
}
module "cluster" {
source = "brikis98/devops/book//modules/eks-cluster"
version = "1.0.0"
name = "eks-sample" (1)
eks_version = "1.32" (2)
instance_type = "t2.micro" (3)
min_worker_nodes = 3 (4)
max_worker_nodes = 10 (5)
}The preceding code configures the following parameters:
| 1 | name: The name to use for the control plane, worker nodes, etc. |
| 2 | eks_version: The version of Kubernetes to use. |
| 3 | instance_type: The type of instance to run for worker nodes. |
| 4 | min_worker_nodes: The minimum number of worker nodes to run. |
| 5 | max_worker_nodes: The maximum number of worker nodes to run. |
To deploy the EKS cluster, authenticate to AWS, and run the following commands:
$ tofu init
$ tofu applyAfter 3-5 minutes, the cluster should finish deploying. To explore the cluster with kubectl, you first need to
authenticate to your cluster. The aws CLI has a built-in command for doing this:
aws eks update-kubeconfig --region <REGION> --name <CLUSTER_NAME>
Where <REGION> is the AWS region you deployed the EKS cluster into and <CLUSTER_NAME> is the name of the EKS
cluster. The preceding code used us-east-2 and eks-sample for these, respectively, so you can run the following:
aws eks update-kubeconfig --region us-east-2 --name eks-sample
Once this is done, try running get nodes:
$ kubectl get nodes
NAME STATUS ROLES AGE
ip-172-31-21-41.us-east-2.compute.internal Ready <none> 5m
ip-172-31-34-203.us-east-2.compute.internal Ready <none> 5m
ip-172-31-4-188.us-east-2.compute.internal Ready <none> 5mThis output looks a bit different from when you ran the command with the Kubernetes cluster from Docker Desktop. You should see three nodes, each of which is an EC2 instance in your managed node group.
The next step is to try deploying the sample app into the EKS cluster. However, there’s one problem: you’ve created a Docker image for the sample app, but that image only lives on your own computer. The EKS cluster in AWS won’t be able to fetch the image from your computer, so you need to push the image to a container registry that EKS can read from, as described in the next section.
Example: Push a Docker Image to ECR
There are a number of container registries out there, including Docker Hub, Amazon Elastic Container Registry (ECR), and GitHub Container Registry (full list). If you’re using AWS, the easiest one to use is ECR, so let’s set that up.
For each Docker image you want to store in ECR, you have to create an ECR repository (ECR repo for short). The
blog post series’s sample code repo includes a module called ecr-repo in the ch3/tofu/modules/ecr-repo folder
that you can use to create an ECR repo. To use the ecr-repo module, create a new folder called live/ecr-sample:
$ cd fundamentals-of-devops
$ mkdir -p ch3/tofu/live/ecr-sample
$ cd ch3/tofu/live/ecr-sampleIn that folder, create main.tf with the contents shown in Example 53:
Example 53. Use the
ecr-repo module (ch3/tofu/live/ecr-sample/main.tf)provider "aws" {
region = "us-east-2"
}
module "repo" {
source = "brikis98/devops/book//modules/ecr-repo"
version = "1.0.0"
name = "sample-app"
}This code will create an ECR repo called "sample-app." Typically, the repo name should match your Docker image name.
You should also create outputs.tf with an output variable, as shown in Example 54:
Example 54. Output variables (ch3/tofu/live/ecr-sample/outputs.tf)
output "registry_url" {
description = "URL of the ECR repo"
value = module.repo.registry_url
}The preceding code will output the URL of the ECR repo, which you’ll need to be able to push and pull images. To create the ECR repo, run the following commands:
$ tofu init
$ tofu applyAfter a few seconds, you should see the registry_url output:
Apply complete! Resources: 1 added, 0 changed, 0 destroyed.


Outputs:


registry_url = "111111111111.dkr.ecr.us-east-2.amazonaws.com/sample-app"
Copy down that registry_url value, as you’ll need it shortly.
Before you can push your Docker image to this ECR repo, you have to build the image with the right CPU architecture.
By default, the docker build command builds your Docker image for whatever CPU architecture you have on your own
computer. For example, if you’re on a recent Macbook with an ARM CPU (e.g., the M series), your Docker images will be
built for the arm64 architecture, which won’t work in the EKS cluster you just deployed, as the t2.micro worker
nodes in that cluster use the amd64 architecture.
Therefore, you need to ensure that you build your Docker images for whatever architecture(s) you plan to deploy onto.
Fortunately, Docker now ships with the buildx command, which makes it easy to build Docker images for multiple
architectures. The first time you use buildx, you need to create a multi-platform-builder for your target
architectures. For example, if you’re on an arm64 Mac, and you’re going to be deploying onto amd64 Linux servers,
use the following command:
$ docker buildx create \
--use \
--platform=linux/amd64,linux/arm64 \
--name multi-platform-builderNow you can run the following command to build a Docker image of the sample app for both architectures (note the use of
a new tag, v3, for these images):
$ docker buildx build \
--platform=linux/amd64,linux/arm64 \
--load \
-t sample-app:v3 \
.|
You must enable containerd for images
In order to use the |
Once the Docker image is built, to be able to push it to ECR, you need to tag it using the registry URL of the
ECR repo that you got from the registry_url output:
docker tag \

  sample-app:v3 \

  <YOUR_ECR_REPO_URL>:v3
Next, you need to authenticate to your ECR repo, which you can do using the aws and docker CLI tools, making sure
to replace the last argument with the registry URL of your own ECR repo that you got from the registry_url output:
$ aws ecr \
get-login-password \
--region us-east-2 | \
docker login \
--username AWS \
--password-stdin \
<YOUR_ECR_REPO_URL>Finally, you can push the Docker image to your ECR repo:
$ docker push <YOUR_ECR_REPO_URL>:v3The first time you push, it may take a minute or two to upload the image. Subsequent pushes should be faster due to Docker’s layer caching.
Example: Deploy a Dockerized App into an EKS Cluster
At this point, you are ready to deploy the sample app Docker image into the EKS cluster. The only change you need to
make to the YAML you used to deploy locally is to switch the image in kubernetes/sample-app-deployment.yml to the
v3 ECR repo URL, as shown in Example 55:
Example 55. Use the ECR repo URL (ch3/kubernetes/sample-app-deployment.yml)
spec:
# (... other params omitted for clarity ...)
spec:
containers:
- name: sample-app
image: <YOUR_ECR_REPO_URL>:v3You can now apply both YAML files to deploy into your EKS cluster:
$ kubectl apply -f sample-app-deployment.yml
$ kubectl apply -f sample-app-service.ymlAfter a minute or two, if you run the get pods command, you should see something like this:
$ kubectl get pods
NAME READY STATUS RESTARTS AGE
sample-app-deployment-59f5c6cd66-nk45z 1/1 Running 0 1m
sample-app-deployment-59f5c6cd66-p5jxz 1/1 Running 0 1m
sample-app-deployment-59f5c6cd66-pmjns 1/1 Running 0 1mAnd if you run get services, you should see something like this:
NAME                     TYPE          EXTERNAL-IP                     PORT(S)

kubernetes               ClusterIP     <none>                          443

sample-app-loadbalancer  LoadBalancer  xx.us-east-2.elb.amazonaws.com  80:3225
If you look at the EXTERNAL-IP for sample-app-loadbalancer, you should see the domain name of an AWS ELB. Open this
URL:
$ curl xx.us-east-2.elb.amazonaws.com
Fundamentals of DevOps!If you get "Could not resolve host" errors, it’s probably because the load balancer is still booting up or the health checks haven’t passed yet. Give it a minute or two more, and try again, and you should see the familiar "Fundamentals of DevOps!" text. Congrats, you’re now running a Dockerized application in a Kubernetes cluster in AWS!
|
Get your hands dirty
Here are a few exercises you can try at home to go deeper:
|
When you’re done experimenting with the EKS cluster, run tofu destroy on both the eks-cluster and ecr-repo
modules to undeploy all your infrastructure.
You’ve now seen server orchestration, VM orchestration, and container orchestration. That leaves just one orchestration approach to explore: serverless orchestration.
Serverless Orchestration
All the orchestration options you’ve seen so far have required you to think about and manage the servers you’re using, though a bit less with each step up the abstraction ladder. The idea behind serverless is to allow you to focus entirely on your app code, without having to think about servers at all. There are of course still servers there, but they are behind the scenes, and fully managed for you.
The original model referred to as "serverless" was Functions as a Service (FaaS), which works as follows:
-
Create a deployment package which contains just the source code to run one function (rather than a whole app).
-
Upload the deployment package to your serverless provider, which is typically a cloud provider like AWS, GCP, or Azure (although you can also use tools like Knative to add support for serverless in your on-prem Kubernetes cluster).
-
Configure the serverless provider to trigger your function in response to certain events: e.g., an HTTP request, a file upload, a new message in a queue.
-
When the trigger goes off, the serverless provider executes your function, passing it information about the event as an input, and, in some cases, taking the data the function returns as an output, and passing it on elsewhere (e.g., sending it as an HTTP response).
-
To deploy an update, you create a new deployment package, upload it to the serverless provider, and the provider will use it to respond to all future triggers.
|
Key takeaway #4
Serverless orchestration is an immutable infrastructure approach where you deploy and manage functions without having to think about servers at all. |
There are a few key points that are easy to miss that make the FaaS model stand out from all the other orchestration options:
- You focus on your code, not on the hardware
-
The goal of serverless is that you don’t have to think about the hardware at all. If your trigger goes off 1,000 times per second or once per year, it’s completely up to the serverless provider to manage the servers, clusters, auto scaling, and auto healing that are necessary to handle that load.
- You focus on your code, not the OS
-
The deployment package only includes your app code. Notably, it does not include anything about the OS or other tooling. Running, securing, and updating the OS is completely handled by the serverless provider.
- You get even more speed
-
Whereas the build and deploy cycle takes 5-30 minutes with VMs and 1-5 minutes with containers, with serverless, it can take less than a minute.
- You get even more efficiency
-
Serverless can make even more efficient use of computing resources than containers. Instead of scheduling long-running apps, you schedule short-running functions, which you can move around the cluster extremely quickly onto any server that has spare resources. While these benefits mostly accrue to the cloud providers, they do pass some of those cost savings down to the end-user too, offering serverless at incredibly low prices.[14]
- Pricing scales perfectly with usage
-
With other orchestration approaches, you typically pay per hour to rent whatever hardware you need, even if that hardware is sitting completely idle, whereas with FaaS, the pricing scales perfectly with usage, so you pay more if usage is high, you pay less if usage is low, and you pay nothing if usage is zero (known as scale to zero). Moreover, with FaaS, performance optimizations have an almost 1:1 correlation with cost reduction. If you make your code run 10% faster, your costs will drop by roughly 10%. With other orchestration tools, pricing does not scale with this level of granularity.
While FaaS has some major benefits, it also has a number of limitations:
- Size limits
-
There are usually limits on deployment package size, event payload size, and response payload size.
- Time limits
-
There is usually a maximum amount of time that your functions can run for (e.g., 15 minutes with AWS Lambda).
- Disk space
-
You typically only have a small amount of storage available locally, and it’s usually ephemeral, so you can’t store anything permanent on it.
- Performance
-
Since the servers are hidden from you, you have little control over the hardware that you’re using, which can make performance tuning difficult.
- Debugging
-
You usually can’t connect to the servers directly (e.g. via SSH), which can make debugging difficult.
- Cold starts
-
Serverless often struggles with cold starts, where on the first run, the first run after a period of idleness, or the first run after a significant burst in traffic, the serverless provider needs to download and boot up your deployment package, which can add as much as several seconds of overhead. For some use cases, such as responding to live HTTP requests, this is unacceptably slow.
- Long-running connections
-
Use cases such as database connection pools and WebSockets are typically more complicated with FaaS. For example, with AWS Lambda, if you want a database connection pool, you have to use a separate service called Amazon RDS Proxy.
The FaaS model of serverless first became prominent in 2015 with the release of AWS Lambda. It quickly grew in popularity, and since then, other cloud providers have released their own FaaS offerings, such as GCP Cloud Functions and Azure serverless (full list). In fact, serverless has become so popular, that these days, the term is being applied not only to FaaS, but other models, too:
- Serverless containers
-
A number of cloud providers these days allow you to run containers without having to manage the servers or clusters under the hood. For example, AWS Fargate lets you use Amazon EKS or Amazon ECS without having to manage the control plane or worker nodes yourself. Combining containers with serverless helps work around some of the limitations of FaaS: e.g., you can have long-running containers, which avoids issues with cold starts and long-running connections. Also, containers give you greater portability than FaaS, as FaaS depends on provider-specific deployment packages. However, containers are typically larger and container orchestration tools tend to be slower to scale and deploy, so you nullify some of the speed benefits, and long-running containers nullify the scale-to-zero benefits.
- Serverless databases
-
The term serverless is now being applied to databases too, such as Amazon Aurora Serverless. In this case, the term serverless typically implies two things. First, you can use these databases without having to worry about running or managing the underlying servers, hard-drives, etc. Second, these databases can typically scale to zero when not in use, so you don’t have to pay hourly to run a server when things are idle (however, you still pay for data storage).
To get a feel for serverless, let’s try out what is arguably the most popular approach, which is AWS Lambda and FaaS. First, you’re going to deploy a Lambda function that can respond with "Hello, World!", and second, you’ll deploy a Lambda function URL to trigger the Lambda function when HTTP requests come in.
Example: Deploy a Serverless Function with AWS Lambda
The blog post series’s sample code repo includes a module called lambda in the ch3/tofu/modules/lambda folder that
can do the following:
-
Zip up a folder you specify into a deployment package.
-
Upload the deployment package as an AWS Lambda function.
-
Configure various settings for the Lambda function, such as memory, CPU, and environment variables.
To use the lambda module, create a live/lambda-sample folder to use as a root module:
$ cd fundamentals-of-devops
$ mkdir -p ch3/tofu/live/lambda-sample
$ cd ch3/tofu/live/lambda-sampleIn that folder, create main.tf with the contents shown in Example 56:
Example 56. Use the
lambda module (ch3/tofu/live/lambda-sample/main.tf)provider "aws" {
region = "us-east-2"
}
module "function" {
source = "brikis98/devops/book//modules/lambda"
version = "1.0.0"
name = "lambda-sample" (1)
src_dir = "${path.module}/src" (2)
runtime = "nodejs20.x" (3)
handler = "index.handler" (4)
memory_size = 128 (5)
timeout = 5 (6)
environment_variables = { (7)
NODE_ENV = "production"
}
}This code sets the following parameters:
| 1 | name: The name to use for the Lambda function and all other resources. |
| 2 | src_dir: The directory which contains the code for the Lambda function. The lambda module will zip this folder
up into a deployment package. Example 57 shows the contents of this folder. |
| 3 | runtime: The runtime used by this function. AWS Lambda supports several different runtimes, including Node.js,
Python, Java, Ruby, and .NET. |
| 4 | handler: The handler or entrypoint to call your function. The format is <FILE>.<FUNCTION>, where
<FILE> is the file in your deployment package and <FUNCTION> is the name of the function to call in that file.
Lambda will pass this function the event information. The preceding code sets the handler to the handler function
in index.js, which is shown in Example 57. |
| 5 | memory_size: The amount of memory to give the Lambda function. Adding more memory also proportionally increases
the amount of CPU available, as well as the cost to run the function. |
| 6 | timeout: The maximum amount of time the Lambda function has to run. The timeout limit is 15 minutes. |
| 7 | environment_variables: Environment variables to set for the function. The preceding code sets the NODE_ENV
environment variable to "production" to tell the Node.js app and all its dependencies to run in production mode. |
Create a folder in lambda-sample/src, and inside that folder, create a file called index.js, which defines the handler, as shown in Example 57:
Example 57. The handler code in index.js (ch3/tofu/live/lambda-sample/src/index.js)
exports.handler = (event, context, callback) => {
callback(null, {statusCode: 200, body: "Hello, World!"});
};As you can see, this is a function that takes the event object as input and then uses the callback to return
a response which is a 200 OK with the text "Hello, World!" Deploy the lambda-sample module the usual way:
$ tofu init
$ tofu applyapply should complete in just a few seconds; Lambda is fast! To see if it worked, open the
Lambda console in your browser, click on the function called
"sample-app-lambda," and you should see your handler code, as shown in Figure 26:
Figure 26. The Lambda console shows your newly created function
Currently, the function has no triggers, so it doesn’t really do anything. You can manually trigger it by clicking the
blue Test button. The console will pop up a box where you can enter test data in JSON format to send to the function
as the event object; leave everything at its default value and and click the Invoke button. That should run your
function and show you log output that looks similar to Figure 27:
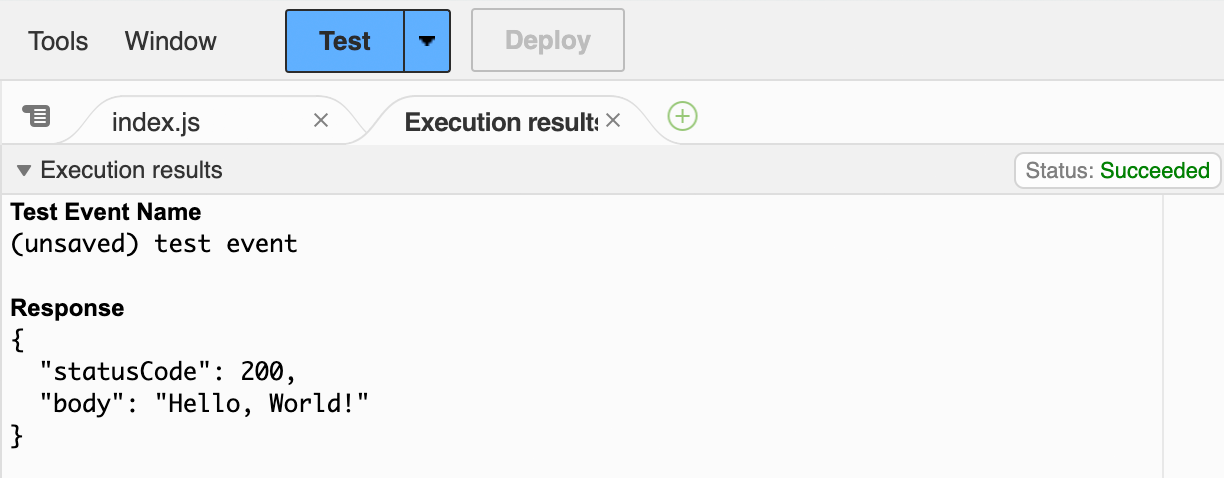
Figure 27. The output from manually triggering the Lambda function with a test event
As you can see, your function has run, and responded with the expected 200 OK and "Hello, World!" Triggering Lambda functions manually is great for learning and testing, but in the real world, if you want to build a serverless web app, you need to trigger the function with HTTP requests, as described in the next section.
Example: Create a Lambda Function URL
You can configure AWS to trigger a Lambda function each time you receive an HTTP(S) request by creating a Lambda
function URL. Example 58 shows how to update the lambda-sample module to create a Lambda function URL:
Example 58. Create a Lambda function URL (ch3/tofu/live/lambda-sample/main.tf)
module "function" {
source = "brikis98/devops/book//modules/lambda"
version = "1.0.0"
# ... (other params omitted) ...
create_url = true
}Setting create_url to true tells the lambda module to create a Lambda function URL. You should also add the
function URL as an output variable in a new file called outputs.tf, as shown in Example 59:
Example 59. Output variables (ch3/tofu/live/lambda-sample/outputs.tf)
output "function_url" {
description = "The URL of the Lambda function"
value = module.function.function_url
}Deploy the updates:
$ tofu init
$ tofu applyWhen apply completes, you should see the function_url output:
Outputs:


function_url = "https://omhowbrsutqjt.lambda-url.us-east-2.on.aws/"
Open this URL, and you should see "Hello, World!" Congrats, a Lambda function URL is now routing HTTP requests to your Lambda function! AWS will automatically scale your Lambda functions up and down in response to load, including scaling to zero when there is no load.
Example: Roll Out Updates with AWS Lambda
By default, AWS Lambda natively supports a nearly instantaneous deployment model. That is, if you upload a new deployment package, all new requests will start executing the code in that deployment package more or less immediately. For example, try updating lambda-sample/src/index.js to respond with "Fundamentals of DevOps!" rather than "Hello, World!", as shown in Example 60:
Example 60. Update the response text (ch3/tofu/live/lambda-sample/src/index.js)
exports.handler = (event, context, callback) => {
callback(null, {statusCode: 200, body: "Fundamentals of DevOps!"});
};Re-run apply to deploy these changes:
$ tofu applyapply should complete in a few seconds, and if you retry the function_url URL, you’ll see "Fundamentals of DevOps!"
right away. So again, deployments with Lambda are fast!
|
Get your hands dirty
To avoid introducing too many new tools, this blog post uses OpenTofu to deploy Lambda functions, which works great for functions used for background jobs, event processing, and simple web apps, but I don’t recommend it for more complicated web apps (with many functions and HTTP endpoints), as the code can become verbose, and there’s no easy way to test it locally (especially the HTTP portion). For serverless web apps, you may want to instead try out tools like the Serverless Framework or SAM (full list). |
When you’re done experimenting with the serverless code, run tofu destroy to undeploy all your infrastructure.
Comparing Orchestration Options
You’ve now seen the most common approaches to orchestration: server orchestration, VM orchestration, container orchestration, and serverless orchestration. Table 6 shows how these orchestration approaches compare in their ability to solve the core orchestration problems introduced in the beginning of the blog post:
|
Lossy compression
The tables in this section try to show what you should expect from the typical tools in each orchestration category, but as there are dozens of tools within each category, compressing so much information into a table means some information inevitably gets lost. |
| Problem | Server orchestration | VM orchestration | Container orchestration | Serverless orchestration |
|---|---|---|---|---|
Deployment |
E.g., Ansible rolling deployments. |
E.g., ASG rolling deployments. |
E.g., K8S rolling, canary, blue-green.[15] |
|
Scheduling |
Manual scheduling. Pay per server. |
E.g., ASG scheduler. Pay per VM. |
E.g., K8S scheduler. Pay per server. |
E.g., Lambda scheduler. Pay for execution time. |
Rollback |
No rollback with mutable infrastructure. |
Roll back to previous immutable version. |
Roll back to previous immutable version. |
Roll back to previous immutable version. |
Auto scaling |
Manual scaling. |
E.g., ASG auto scaling. |
E.g., K8S auto scaling. |
Done for you.[16] Scale to 0. |
Auto healing |
Manual healing. |
E.g., ASG health checks. |
E.g., K8S probes. |
Done for you. |
Configuration |
E.g., Ansible variables, roles, templates, etc. |
E.g., OpenTofu module that exposes variables. |
E.g., K8S ConfigMaps. |
E.g., Lambda with SSM Parameter Store. |
Secrets management |
E.g., Ansible Vault. |
E.g., Read from a secret store during boot. |
E.g., K8S Secrets. |
E.g., Lambda with AWS Secrets Manager. |
Load balancing |
E.g., Deploy Nginx. |
E.g., ALBs. |
E.g., K8S Services. |
E.g., Lambda URL. |
Service communication |
Manually-managed. |
E.g., Use ALBs with ASGs. |
E.g., K8S Services. |
E.g., Lambda Invoke. |
Disk management |
Manually manage hard drives. |
E.g., ASG EBS Volumes.[17] |
E.g., K8S Volumes and Persistent Volumes. |
E.g., The file system for Lambda is read-only. |


From this table, it should be clear why there’s so much excitement around container orchestration (especially Kubernetes) and serverless orchestration (especially AWS Lambda): they solve so many of the core orchestration problems for you out-of-the-box! However, the core orchestration problems aren’t the entire picture. They define what an orchestration tool should do (functional requirements), but not how well it does it (non-functional requirements). Table 7 is an attempt to capture how orchestration tools compare across some of the key non-functional requirements:
| Dimension | Server orchestration | VM orchestration | Container orchestration | Serverless orchestration |
|---|---|---|---|---|
Deployment speed |
5-60 minutes. |
5-30 minutes. |
1-5 minutes. |
1 minute. |
Maintenance |
E.g., Maintain servers, Chef masters. |
E.g., Maintain servers, VMs. |
E.g., Maintain servers, K8S cluster, containers. |
E.g., Maintain apps. |
Dev/prod parity |
E.g., It’s rare to use Ansible in dev. |
E.g., You can’t run an AWS ASG in dev. |
E.g., It’s common to run Docker and K8S in dev. |
E.g., It’s common to run serverless in dev. |
Maturity |
Oldest approach. Mostly open source. |
Second-oldest approach. Mostly proprietary. |
Newer approach. Mostly open source. |
Newest approach. Mostly proprietary. |
Debugging |
Server access, simple abstractions, mutable. |
Server access, simple abstractions, immutable. |
Server access, complex abstractions, immutable. |
No server access, complex abstractions, immutable. |
Performance tuning |
Control hardware. |
Control hardware, noisy neighbors.[18] |
Control hardware, noisier neighbors. |
No hardware control, noisier neighbors, cold starts. |
Ease of learning |
|
|
|
|
Long-running tasks |
|
|
|
|
While container and serverless orchestration come off as clear winners from a purely functional comparison, the picture is not as clear when you consider non-functional requirements. I’ve seen a number of companies who use container orchestration tools such as Kubernetes struggle with maintenance, debugging, performance tuning, and ease-of-learning: e.g., see the stories from Crafting Code, Basecamp, and trivago. I’ve also seen a number of companies who use serverless orchestration tools such as AWS Lambda struggle with debugging, performance tuning, long-running tasks, and a general lack of maturity: e.g., see the stories from Knock, Prismatic, and even Amazon’s own Prime Video team. Keep these stories in mind when you’re picking an orchestration tool for your company, and use Table 6 and Table 7 to pick the right tool for the job.
Conclusion
You now know how to deploy and manage your apps in a way that more closely handles the demands of production, including using multiple replicas to avoid having a single point of failure, deploying load balancers to distribute traffic across the replicas, and using deployment strategies to roll out updates to your replicas without downtime. You’ve seen a number of orchestration approaches for handling all of this, summarized via the 4 takeaways from this Part:
-
Server orchestration is an older, mutable infrastructure approach where you have a fixed set of servers that you maintain and update in place.
-
VM orchestration is an immutable infrastructure approach where you deploy and manage VM images across virtualized servers.
-
Container orchestration is an immutable infrastructure approach where you deploy and manage container images across a cluster of servers.
-
Serverless orchestration is an immutable infrastructure approach where you deploy and manage functions without having to think about servers at all.
As you worked your way through the first few parts of this blog post series, you wrote and executed a bunch of code, including Node.js, Ansible, OpenTofu, Docker, YAML, and so on. So far, you’ve been working on all this code alone, but in the real world, you’ll most likely need to work on code with a whole team of developers. How do you collaborate on code as a team so you aren’t constantly overwriting each other’s changes? How do you minimize bugs and outages? How do you package and deploy your changes on a regular basis? These questions are the focus of Part 4, How to Version, Build, and Test Your Code.
Update, June 25, 2024: This blog post series is now also available as a book called Fundamentals of DevOps and Software Delivery: A hands-on guide to deploying and managing software in production, published by O’Reilly Media!
Last updated 2025-02-17 01:44:24 UTC


